Part of: Risk Management
Portfolio Credibility
Conviction is self-reported; credibility is externally anchored. The two diverge exactly where mistakes live, an 8% position in a name you love with a…
 Marcus Chen7 min read
In late 2022 I reviewed my own book and ran a credibility score across all 14 positions. One position, a specialty retailer I'd held for 18 months through a thesis that had become increasingly story-dependent, scored 31 on the composite. Revenue growth had decelerated from 22% to 4% YoY. Operating margins were compressing. Insiders had been net-sellers for three straight quarters. Institutional ownership had fallen by 4 percentage points over the same window. Technical structure was broken (below 200-day, negative RS). The "evidence" consensus across five independent factor families was screaming that the thesis had stopped working. My conviction, meanwhile, was still high, I'd done the original work, I knew the product category, I trusted the management team. The conviction was emotional; the credibility was numerical. The position was 7.2% of my book. I trimmed it to 3% over two sessions, costing myself very little in realized P&L because the price had already drifted. Over the next six months the stock fell another 34% on a missed quarter and a guidance cut. Had I stayed at 7.2%, that single position would have given back roughly 240 bps of portfolio return. The credibility score didn't predict the miss; it didn't need to. It simply quantified that the weight I was giving the name was dramatically out of line with the supporting evidence.
This post is about the Portfolio Credibility card, why credibility catches what conviction doesn't, and the three behaviors that credibility scoring unlocks for portfolio hygiene.
TL;DR
- Conviction is self-reported; credibility is evidence-anchored. The two diverge exactly where mistakes compound.
- Five evidence families drive the composite: fundamentals, valuation, technicals, flow, regime fit.
- Trim positions with credibility < 40 and size > 3%. Over-sized under-evidenced positions are the biggest drawdown source.
- Add to positions with credibility > 75 and size < 1%. Under-sized over-evidenced is the inverse mistake.
- Portfolio-weighted credibility < 60 means the book is narrative-heavy. Not a timing tool, but a sanity check.
Why credibility catches what conviction doesn't
Conviction is what you feel about a position. You've done the work, you like the story, you trust the management, the thesis makes sense to you. Conviction is self-reported and self-reinforcing, the longer you hold a position, the more conviction you build in it, whether or not the evidence continues to support the thesis. That asymmetry is why conviction is a poor standalone portfolio management tool.
Credibility is what the data says about the position. The revenue is or isn't growing. The margins are or aren't expanding. The insiders are or aren't buying. The technicals are or aren't intact. Credibility is externally anchored, it doesn't care how long you've held the name or how much work you did originally. It scores the position against evidence that updates every reporting period.
The two often diverge. The divergence is where mistakes live:
- High conviction, low credibility. You love the name; the data has stopped supporting the thesis. This is the category that hurts most in drawdowns.
- Low conviction, high credibility. You're uncertain; the data is strong. This is the inverse mistake, an under-sized name that deserves more weight.
- High conviction, high credibility. Core positions; evidence and narrative align. Carry the weight.
- Low conviction, low credibility. Legacy positions; neither the story nor the data supports them. Exit.
The credibility score doesn't tell you what to do; it tells you which quadrant a position is in, which is the starting point for any position-sizing decision.
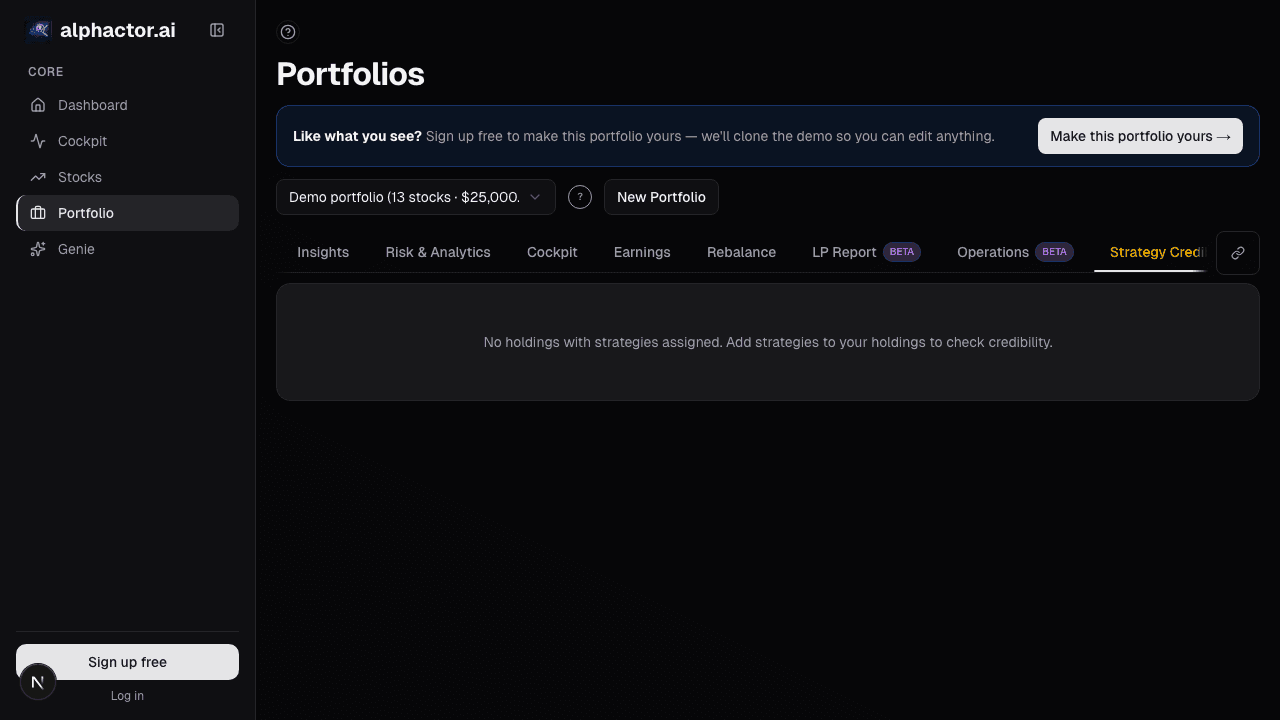
What the Portfolio Credibility card shows
The Portfolio Credibility card scores every holding on a 0-100 composite built from five evidence families:
- Fundamentals: revenue + margin + FCF trend quality, accruals quality, earnings stability
- Valuation: percentile vs. sector, reverse-DCF implied-growth reasonableness
- Technicals: relative strength, trend structure, breadth participation
- Flow: institutional ownership delta, insider MSPR, options positioning
- Regime fit: whether the name historically performs in the current macro regime
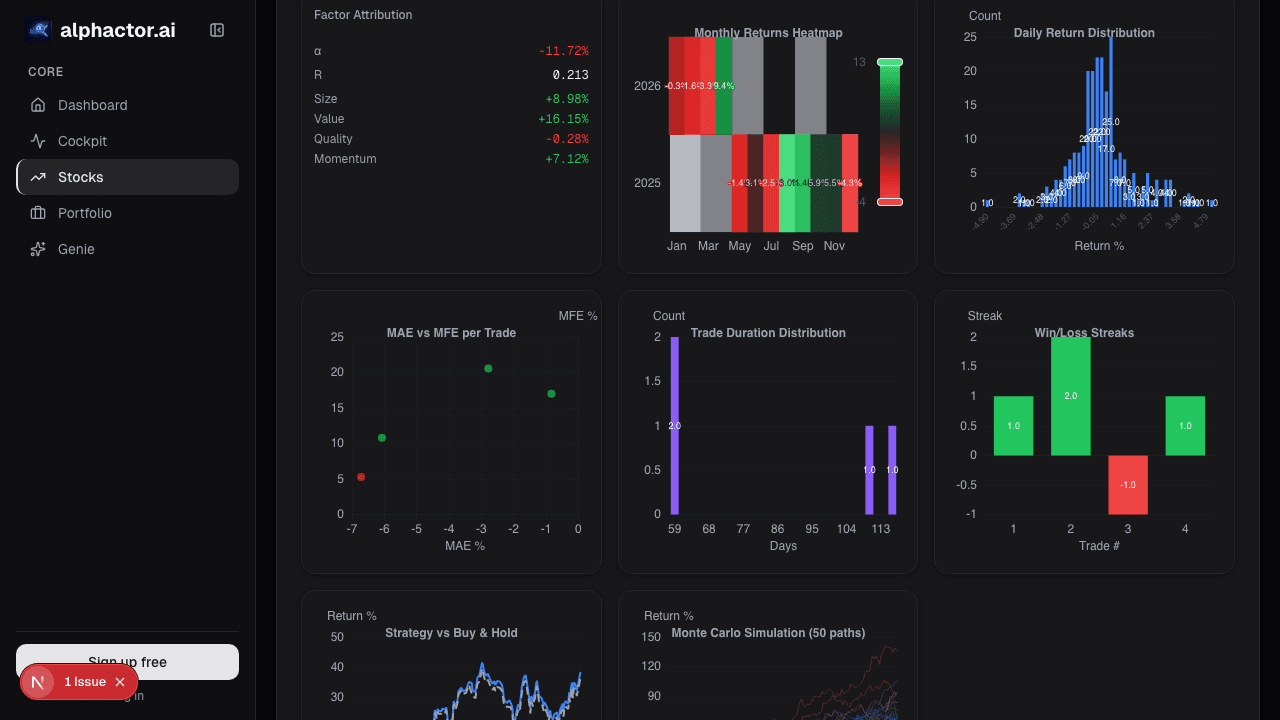
Each family is weighted equally by default; premium users can tune weights. Additional views:
- Per-position breakdown: see which family is dragging a low score (and which is lifting a high one)
- Portfolio-weighted average credibility: the book-level summary number
- Credibility vs. size scatter: visualizes which positions are off the diagonal (over- or under-sized for their credibility)
- Credibility trend per position: trailing 8-quarter composite, so you can see whether credibility is improving or deteriorating
Three behaviors that improve portfolios
Trim positions with credibility < 40 and size > 3%. Over-sized under-supported positions are the category that hurts most in drawdowns, and shrinking them costs very little in opportunity cost, if the evidence improves, you can size up again. The specific cutoffs (40 and 3%) are calibrated; below 40 the evidence is clearly weak across multiple families, and above 3% the position is meaningful enough that the lack of evidence is a real risk.
Add to positions with credibility > 75 and size < 1%. Under-sized high-evidence names are the inverse mistake, the portfolio is under-weighting names that the data strongly supports. The add should respect portfolio-level risk constraints (don't over-concentrate in one sector just because credibility is high), but within those constraints, the asymmetry favors moving toward the evidence.
Portfolio-weighted credibility < 60 means the book is narrative-heavy. Either the evidence improves soon or the book underperforms. The threshold isn't a market timer, it's a sanity check that pushes you to reassess which positions are carrying the book on conviction alone. Books that drift below 60 weighted credibility often contain 2-3 high-weight positions where the thesis has quietly broken. Fixing those positions usually recovers the book-level number.
Example: the 2022 specialty retailer trim
The credibility breakdown for the position I trimmed:
| Family | Score | Rationale |
|---|---|---|
| Fundamentals | 28 | Revenue decel 22% → 4%, margin compression |
| Valuation | 52 | Still above sector median on P/E despite decel |
| Technicals | 24 | Below 200-DMA, negative RS vs. sector |
| Flow | 35 | Insiders net sellers 3 quarters; inst. ownership -4pts |
| Regime fit | 18 | Name underperformed historically in current regime |
| Composite | 31 | , |
All five families low-to-moderate; nothing was saying "this position deserves 7% of the book." Conviction had carried it. Once the numbers were on the screen the answer was obvious; the challenge was the emotional work of closing an 18-month position. The card doesn't do that work, it only makes the gap visible, which is enough to make the trim decision rational instead of requiring willpower.
What credibility can miss
- Pre-thesis names. Credibility is lagging, it scores what has happened. A company in a genuine turnaround earns a low credibility score until the numbers turn, which can be several quarters after the inflection.
- Event-driven names. A position held for a specific catalyst (M&A, FDA decision) has credibility dominated by base rates; the event itself isn't captured.
- Special situations. Spinoffs, post-bankruptcy equity, complex capital structures, the composite assumes a normal operating business.
- Hedging context. A credibility-35 short position is very different from a credibility-35 long position; the card scores the name, not the portfolio role.
- Illiquid names. Some factors (flow data, technicals) require sufficient trading activity. Thinly-traded names score with wider uncertainty.
Common mistakes
- Reading composite in isolation. The per-family breakdown tells you *why* the score is what it is. A composite of 50 with 4 families at 60 and 1 at 10 is different from a composite of 50 with all 5 at 50.
- Treating credibility as a buy/sell signal. It's a weight-sizing diagnostic, not a trade signal.
- Ignoring trend. A credibility score of 55 that's been rising for 4 quarters is different from a 55 that's been falling for 4 quarters.
- Applying the same thresholds across mandates. A concentrated high-conviction book may tolerate lower credibility on larger positions; a diversified systematic book should enforce tighter thresholds.
- Using credibility instead of conviction, not alongside. The goal is to make the conviction/credibility comparison explicit, not to replace one with the other.
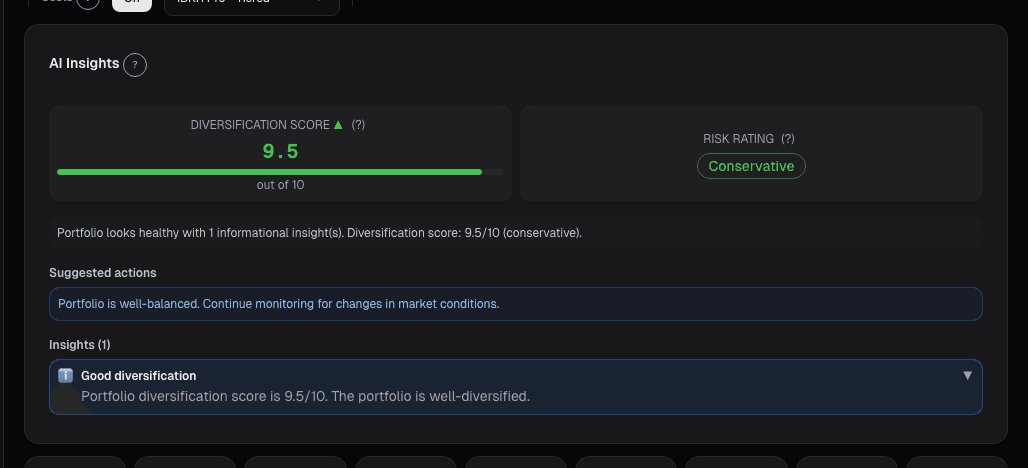
Where it fits
Pair with the per-ticker Conviction Gauge and Conviction Components breakdown for single-name drill-down, and Portfolio AI Insights for natural-language explanations of why specific positions are scoring low. For the rebalance-workflow integration, credibility-weighted sizing is a post-optimizer adjustment you apply before Portfolio Rebalance.
FAQ
How often does the credibility score update?
Fundamentals and flow factors update on filing. Technicals and regime fit update daily. The composite refreshes nightly.
Can I tune the family weights?
Yes, premium users can set custom weights. The defaults (equal-weight) are calibrated on backtest; aggressive weight deviations should be evidence-based.
Does credibility predict returns?
Weakly on its own. The value is in the conviction-credibility gap, positions where your conviction materially exceeds credibility are the ones most likely to underperform.
How does this interact with ESG scores?
ESG is a separate dimension not included in the default composite. Premium users can add ESG as an optional 6th family with user-configurable weight.
Is there an equivalent for short positions?
Yes, short positions are scored with inverted logic (low credibility = strong short evidence). The card flags sign direction.
Related reading
- Portfolio Alt Sentiment Integration
- Portfolio Attribution
- Portfolio Audit Trail
- Portfolio Earnings Cycle
Open the Portfolio Credibility card → /app/portfolio
See it in the app
Live dashboard views that match this post. Each tile deep-links to the exact card.

Stocks mentioned
Related reading
Why Most Backtests Lie
How Alphactor's 8-layer credibility pipeline catches overfitting, data snooping, and curve-fitted strategies before they cost you money.
Alt-Data Sentiment at the Portfolio Level
Per-ticker alt-data breaks down past 10 positions. A roll-up of WSB, news, MSPR, and options lets a 90-second scan replace 100 minutes of manual checking.
Portfolio Attribution: Where Your Returns Actually Come From
Beating the benchmark by 400bps feels good until attribution tells you it was all allocation luck on one sector call. Selection vs. allocation vs.
Portfolio Audit Trail: Every Decision
Regulated managers need an audit trail. The Audit Trail card on alphactor.ai records every trade, rebalance, alert, and note into one timestamped log you…
Portfolio Earnings: Calendar, Exposure
Earnings risk is about the whole book into the week, not each position. When 40% of NAV reports in one week, and 60% of that is in a single sector, you're…
Portfolio Optimizer: From Holdings to an Efficient Frontier
Naive mean-variance overweights recent winners. Running MVO, risk parity, and Black-Litterman in parallel shows which allocation choices are robust vs. fragile.
Ready to try alphactor.ai?
Validate your trading strategies with statistical credibility testing. Start free.
Get Started Free