Part of: Risk Management
Why Most Backtests Lie
How Alphactor's 8-layer credibility pipeline catches overfitting, data snooping, and curve-fitted strategies before they cost you money.
 Marcus Chen5 min read
TL;DR
- A single backtest tells you what happened, not whether the result was robust.
- Alphactor's credibility pipeline checks for data snooping, path dependence, regime fragility, drawdown risk, and parameter instability.
- The goal is not the highest historical return; it is the highest return that still survives credibility validation.
- A lower-return strategy with stable parameters and good out-of-sample behavior is usually more tradable than a perfect equity curve.
The Uncomfortable Truth About Backtesting
You built a strategy. The equity curve looks beautiful. Annual returns of 40%, a Sharpe above 2.0, and a win rate that would make any hedge fund jealous. So you deploy it with real capital and watch it immediately underperform the S&P 500.
This is not a rare experience. It is the default outcome for most retail traders who backtest without credibility validation. The problem is not that backtesting is broken. The problem is that a single backtest answers the wrong question. It tells you what happened. It does not tell you whether those results were skill or luck.
Alphactor's credibility pipeline exists to answer the harder question: would this strategy hold up if history had played out differently? Try it yourself in Alphactor backtesting.
What the 8 Layers Actually Do
Each layer in the pipeline targets a specific failure mode. Here is how they work, in the order they run, and what each one catches.
Layer 1: Deflated Sharpe Ratio. If you tested 50 parameter combinations and picked the one with the highest Sharpe, you did not find a good strategy. You found the luckiest random walk. The Deflated Sharpe Ratio adjusts for the number of trials you ran, correcting for data-snooping bias. A strategy that looks great after testing one configuration is more credible than one that required 200 iterations to find. On Alphactor, you will see your DSR score drop as you test more variations on the same ticker, which is exactly what should happen.
Layer 2: Monte Carlo Simulation. Instead of relying on a single sequence of trades, the platform resamples your trade returns thousands of times in different orders. This builds a confidence interval around your expected performance. If your strategy returns 30% in the actual backtest but Monte Carlo shows that 40% of simulated paths end in a loss, the headline number was misleading.
Layer 3: Walk-Forward Validation. A single train-test split is fragile. It depends entirely on where you drew the line between in-sample and out-of-sample data. Walk-forward validation rolls that boundary forward through time, testing the strategy on multiple unseen windows. A strategy that passes one out-of-sample test might be lucky. A strategy that passes a dozen consecutive ones is demonstrating persistence.
Layer 4: Regime Detection. Markets cycle through distinct conditions: trending bull runs, volatile sell-offs, low-volatility consolidation, and rate-driven rotations. A strategy that only works in one regime is a liability in the others. This layer tests performance across detected market environments and flags strategies that fail outside their comfort zone.
Layer 5: Drawdown Analysis. Maximum drawdown tells you the worst peak-to-trough decline. But one number is not enough. This layer examines drawdown depth, duration, and recovery time across the full test period. It answers questions like: how long did the worst drawdown last? How often did drawdowns exceed 10%? Could you have psychologically held through the worst stretch?
Layer 6: Parameter Stability. This is the overfitting detector. If your RSI strategy works with a 14-period lookback but fails at 13 and 15, you found a parameter island, not a real edge. This layer tests nearby parameter values and checks whether performance degrades gradually or falls off a cliff. Smooth degradation suggests a real signal. Cliff edges suggest noise.
What This Looks Like in Practice
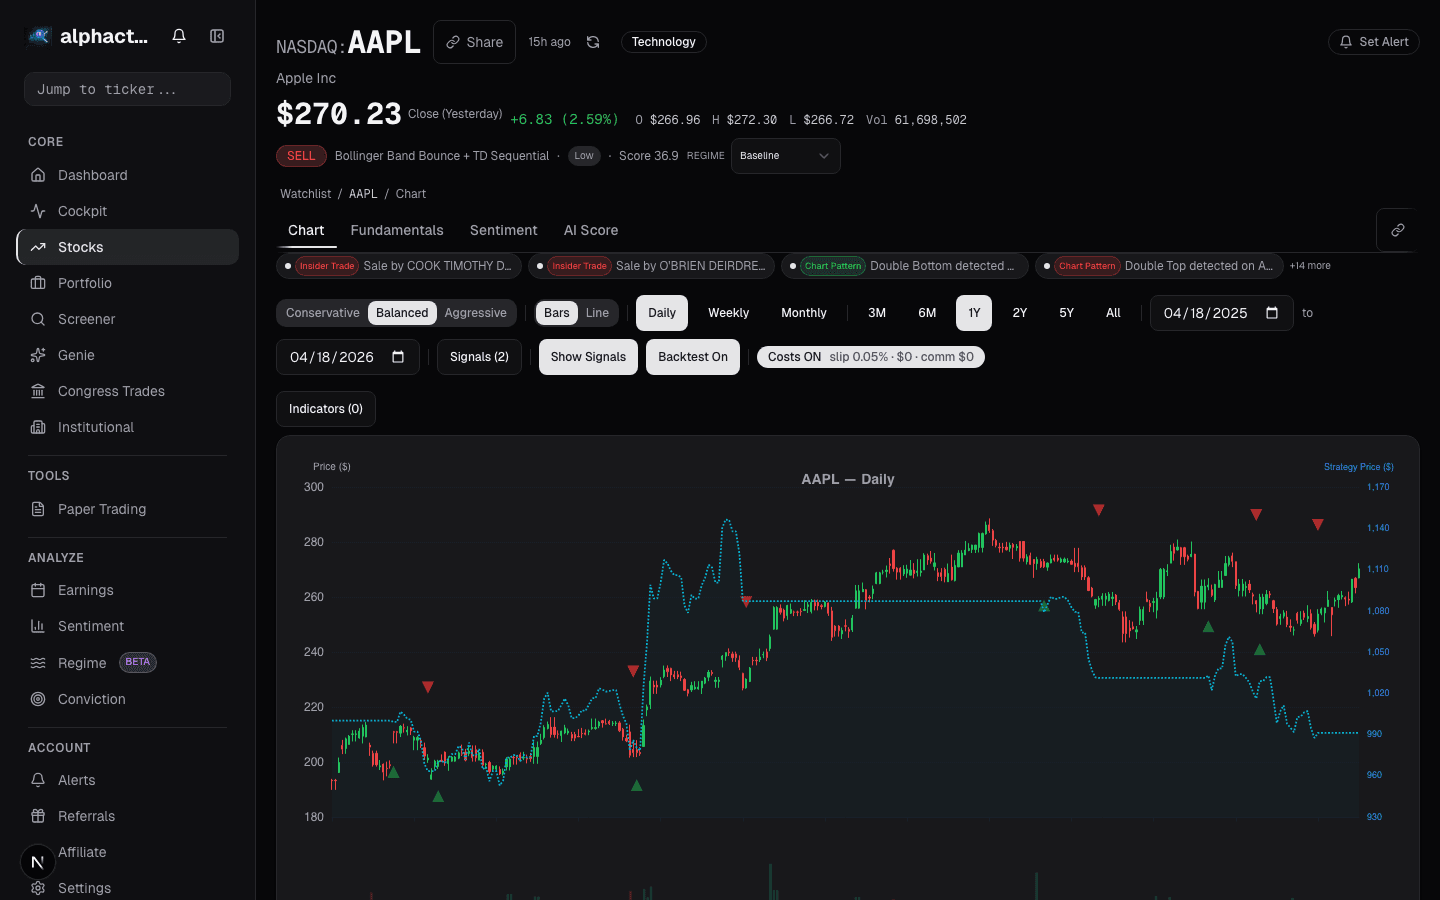
Imagine you are testing a mean reversion strategy on AAPL. You configure a Bollinger Band entry with RSI confirmation, set your parameters, and run the backtest. On Alphactor, the backtest results page does not just show you a return number. It shows a credibility tier: High, Medium, Low, or Unchecked.
A High credibility rating means the strategy passed all eight layers with strong results. A Low rating does not necessarily mean the strategy is bad. It means the evidence is not strong enough to trust. The platform is telling you to investigate further before risking capital.
Before and After the Pipeline
Before credibility testing: You run a backtest, see a 35% annual return, and feel confident. You deploy the strategy. It underperforms because the parameters were overfit to a specific market period that no longer applies.
After credibility testing: You run the same backtest and see the same 35% return. But the credibility tier is Low. Parameter stability shows a cliff edge at nearby values. Regime detection shows the strategy only worked during the 2020-2021 bull run. You refine the strategy, simplify the parameters, and retest. The return drops to 18%, but the credibility tier moves to High. That 18% is something you can actually expect going forward.
Why This Matters for Your Workflow
The credibility pipeline changes how you use backtesting. Instead of searching for the highest return, you search for the highest credible return. Instead of optimizing parameters until the equity curve looks perfect, you optimize until the credibility score is high and the return is acceptable.
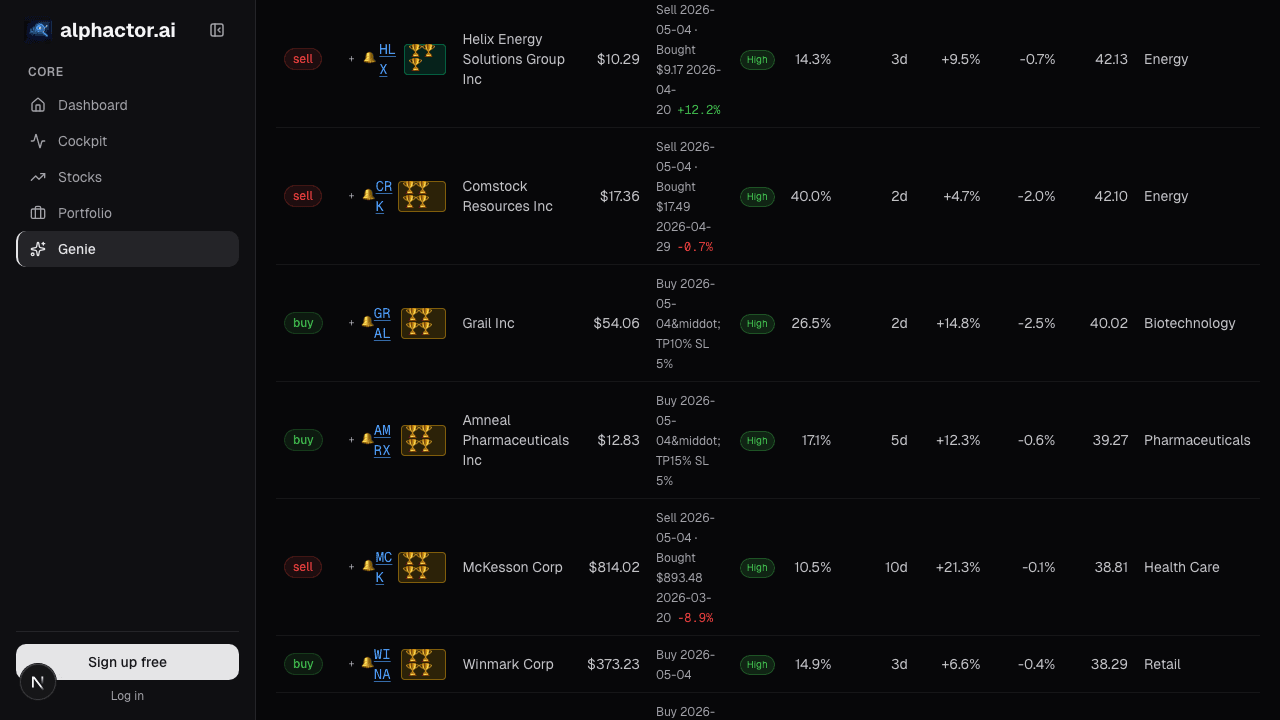
In the universe scanner, strategies are ranked by a composite score that weights credibility heavily. When you see a strategy with a High credibility tier and a score above 7, you know it passed rigorous validation across multiple dimensions. That is a fundamentally different starting point than "this parameter combo returned 40% on historical data."
The pipeline does not guarantee future performance. Nothing can. But it dramatically reduces the probability that you are trading on noise.
FAQ
Why can a profitable backtest still be low credibility?
Because the result may depend on one lucky parameter choice, one favorable market regime, or one unusually good trade sequence. Credibility checks whether the edge remains visible after those supports are stressed.
What is the most important credibility layer?
Parameter stability is usually the first one I check because it catches many overfit strategies quickly. If a strategy only works at one narrow input value, I do not care how attractive the headline return looks.
Does a High credibility tier guarantee future returns?
No. It means the historical evidence is harder to dismiss as noise. Future market structure can still change, so credibility should guide sizing and monitoring rather than replace risk management.
Should I optimize for credibility or return?
Start with credibility, then compare returns among strategies that clear the bar. Chasing the highest historical return first is how most backtests become curve-fitting exercises.
Related posts
See it in the app
Live dashboard views that match this post. Each tile deep-links to the exact card.


Stocks mentioned
Related reading
Cockpit Cards: Quick-Glance Intelligence per Stock
How cockpit cards surface the signals, events, and changes that matter most across your watchlist and portfolio without information overload.
How to Backtest a Trading Strategy (The Right Way)
Learn how to properly backtest trading strategies, avoid common pitfalls like overfitting, and use statistical credibility testing to validate your results.
Portfolio Credibility
Conviction is self-reported; credibility is externally anchored. The two diverge exactly where mistakes live, an 8% position in a name you love with a…
Regime-Aware Strategy Selection
Markets cycle through trends, ranges, and shocks. Learn how regime detection drives which strategy runs, and why a mixture of experts beats a single static…
The 7 Optimization Traps That Kill Backtested Strategies
Seven specific ways traders overfit their backtests, with examples, detection methods, and the statistical tools that separate real edges from noise.
Walk-Forward Testing: The Only Backtest That Matters
Why walk-forward testing is the gold standard for strategy validation, how it works mechanically, and what the efficiency ratio tells you about real versus…
Ready to try alphactor.ai?
Validate your trading strategies with statistical credibility testing. Start free.
Get Started Free