Part of: Fundamental Analysis
Piotroski F-Score
Piotroski's 9 tests filter the value quintile for fundamental improvement. F-scores of 8-9 produced a 72% forward win rate; scores of 0-3 produced only 15%.
 Sarah Patel7 min read
In 2016 I ran a value screen that produced about 200 names in the bottom quintile on P/B. I didn't buy any of them. I spent the next two weeks testing different "cheapness" filters to try to find the subset worth owning, and every filter produced either too few names or too many, with no obvious quality differentiator. I'd been aware of Piotroski's 2000 paper for years but hadn't actually applied the F-Score as a filter on my own screens. When I did, something clear emerged: of the 200 value names, 43 had F-Scores of 8 or 9, 72 had scores of 0–3, and the rest were in between. The F=8-9 bucket had positive 12-month forward returns in 31 of 43 cases (72% hit rate). The F=0-3 bucket had positive returns in 11 of 72 cases (15%). I bought the top-bucket names, passed on the bottom-bucket names, and the screen became tradeable for the first time. The "cheap" part wasn't the edge; the "cheap AND improving fundamentals" was.
This post is about the Piotroski F-Score card, the nine tests that constitute the checklist, and the three interpretation rules that turn a static score into a usable quality signal.
TL;DR
- Piotroski's 9 yes/no tests filter inside the value quintile for actual quality improvement.
- F-Score 8–9 historically compounds double-digit alpha vs. bottom-quintile average.
- Rising F-Score (5 → 8 over quarters) is more actionable than static high score.
- Some failures are mechanical; some are diagnostic. A 7/9 missing "no new share issuance" is much cleaner than 7/9 missing "positive net income."
- F-Score is a quality screen, not a valuation tool. Apply inside a cheap-names filter.
A simpler idea than it looks
Joseph Piotroski's 2000 paper ("Value Investing: The Use of Historical Financial Statement Information to Separate Winners from Losers") showed that inside the cheap-book-value group, the bottom value quintile, financial-strength filtering separated winners from dead money. His score is nine yes/no tests split across profitability, leverage/liquidity, and operating efficiency. Each pass gives one point; a score of 8 or 9 historically compounded double-digit alpha versus the bottom-quintile average.
The uncomfortable insight: cheap stocks don't outperform on average; they outperform *only* in the sub-sample that has improving fundamentals. Without F-Score (or an equivalent quality filter), value investing bleeds to the value traps, names that are cheap because they're structurally broken, with continuing deterioration that keeps them cheap and eventually destroys capital.
The elegance of F-Score is how simple it is. The nine tests are computable from publicly available financial statements; no proprietary data, no machine learning, no multi-factor model. The test is that each criterion corresponds to a specific improvement dimension: is profit rising, is the balance sheet strengthening, is operating efficiency improving? A company answering yes to most of these is doing the things businesses need to do to recover from being cheap.
What the F-Score card shows
The Piotroski F-Score card reports:
- Current score (0–9) with pass/fail breakdown for each of the nine tests
- The underlying calculation visible on hover: no black box
- Trailing-16-quarter chart tracking the score over time to show whether quality is compounding or eroding
- Percentile rank within sector: for sector-relative reading
The nine tests:
Profitability (4 tests)
- Positive net income
- Positive operating cash flow
- ROA higher than prior year
- Cash flow from operations > net income (high-quality earnings)
Leverage / Liquidity (3 tests)
- Lower long-term debt ratio than prior year
- Higher current ratio than prior year
- No new share issuance in the past year
Operating Efficiency (2 tests)
- Higher gross margin than prior year
- Higher asset turnover than prior year
Reading the signal
Score rising. A score moving from 5 to 8 over several quarters is more actionable than a static high score. Rising scores indicate operational turnaround in progress. The 5→8 move captures momentum in profitability, leverage, and efficiency simultaneously, exactly the kind of multi-dimensional improvement that breaks a value trap. The trailing-16-quarter chart makes these trajectories visible.
Test concentration matters. An 8 missing only "no new share issuance" is materially better than an 8 missing "positive net income." Some failures are mechanical (issued shares for an acquisition, which is fine in context); others are diagnostic (didn't generate profit this year, which is the whole question). The per-test breakdown tells you which criteria the name passes and which it fails, letting you weight the failures by significance.
Apply inside a valuation filter. F-Score is a quality screen, not a valuation tool. A high-F-Score growth stock at 30× earnings isn't a Piotroski buy; the paper was specifically about cheap names. Pair F-Score with cheap-book-value, cheap-EV/Sales, or cheap-FCF-yield screens to replicate the original setup. F-Score adds quality diagnostic; valuation provides the cheapness the quality is improving toward.
Example: an F-Score trajectory
A mid-cap industrial I tracked through a turnaround:
| Quarter | Net income | OCF | ROA Δ | OCF > NI | LTD ratio Δ | Curr ratio Δ | Share issuance | GM Δ | Asset turn Δ | F-Score |
|---|---|---|---|---|---|---|---|---|---|---|
| Q1 2022 | ✓ | ✓ | ✗ | ✗ | ✗ | ✓ | ✗ | ✗ | ✓ | 4 |
| Q3 2022 | ✓ | ✓ | ✓ | ✗ | ✓ | ✓ | ✗ | ✓ | ✓ | 6 |
| Q1 2023 | ✓ | ✓ | ✓ | ✓ | ✓ | ✓ | ✓ | ✓ | ✓ | 9 |
| Q3 2023 | ✓ | ✓ | ✓ | ✓ | ✓ | ✓ | ✓ | ✗ | ✓ | 8 |
The trajectory from 4 to 9 over 12 months captured a real operational turnaround: deleveraging (LTD ratio improving), margin recovery, efficiency gains. The stock was at P/B 0.8 at Q1 2022, screening as cheap but with F-Score indicating the cheapness was justified. By Q3 2022 with F=6 rising, the odds of the cheapness being temporary were improving. Went long at Q3 2022 on F=6-and-rising, P/B 0.9. By late 2023 P/B had recovered to 1.6 with F=8-9 persistent. The F-Score was leading the valuation recovery, and the trailing chart made the trajectory legible.
What the F-Score can miss
- Growth businesses. Piotroski was specifically about value. A high-growth company at 20× earnings might score 6–7 on F-Score mechanics without being a value play at all.
- Asset-light businesses. The asset-turnover test is mechanical on low-asset-base businesses; it doesn't mean much for a pure-software company.
- Cyclicals at transitions. A cyclical at the trough mechanically fails many tests (declining net income, declining margin); the F-Score doesn't capture cycle inflection.
- One-time items. Unadjusted net income includes one-time charges and credits; the card's adjusted version backs these out but the adjustment is a judgment.
Common mistakes
- Using F-Score outside the value context. Piotroski's paper was specific to cheap book value. Applying F-Score to growth screens mixes frameworks.
- Treating failures as equivalent. "Issued new shares" is often benign; "generated a loss" is not. Read the per-test breakdown.
- Ignoring the trajectory. A static 8 is different from a 5→8 trajectory. The trajectory is where the turnaround signal lives.
- Using F-Score as the only quality screen. Combine with Accruals Quality and Altman Z for a broader view.
- Expecting F-Score to time the market. It won't. F-Score identifies improving-fundamentals within cheap names; the timing of price reflection varies.
Where it fits
F-Score pairs with the Altman Z-Score (insolvency model, different failure mode) and Accruals Quality (earnings manipulation check). Taken together, the three form a practical solvency/quality/accrual screen that filters most value traps before they show up in the DCF. For the valuation side, combine with FCF Yield, EV/Revenue, or EPV.
FAQ
What's the right F-Score threshold?
Piotroski's paper used 8–9 as the top bucket. For screening, I use F-Score ≥ 7 with improving trajectory (current > prior year).
How often does the score update?
On filing. Quarterly with 10-Q; annually with 10-K. The card updates within hours of filing.
Does F-Score work in non-US markets?
Yes, the test structure is jurisdiction-agnostic, though accounting standard differences (IFRS vs. GAAP) affect some inputs. The card supports international names where financials are available.
Is F-Score still effective in 2026?
Out-of-sample replications continue to show modest outperformance for the F=8-9 bucket inside value screens. The effect has compressed as the signal has become better-known, but remains a useful filter.
Can I screen on F-Score?
Yes, the Screener supports F-Score bands and trajectory filters. A reasonable starting screen: F-Score ≥ 7, F-Score > prior year, P/B in bottom 30% of sector.
Related reading
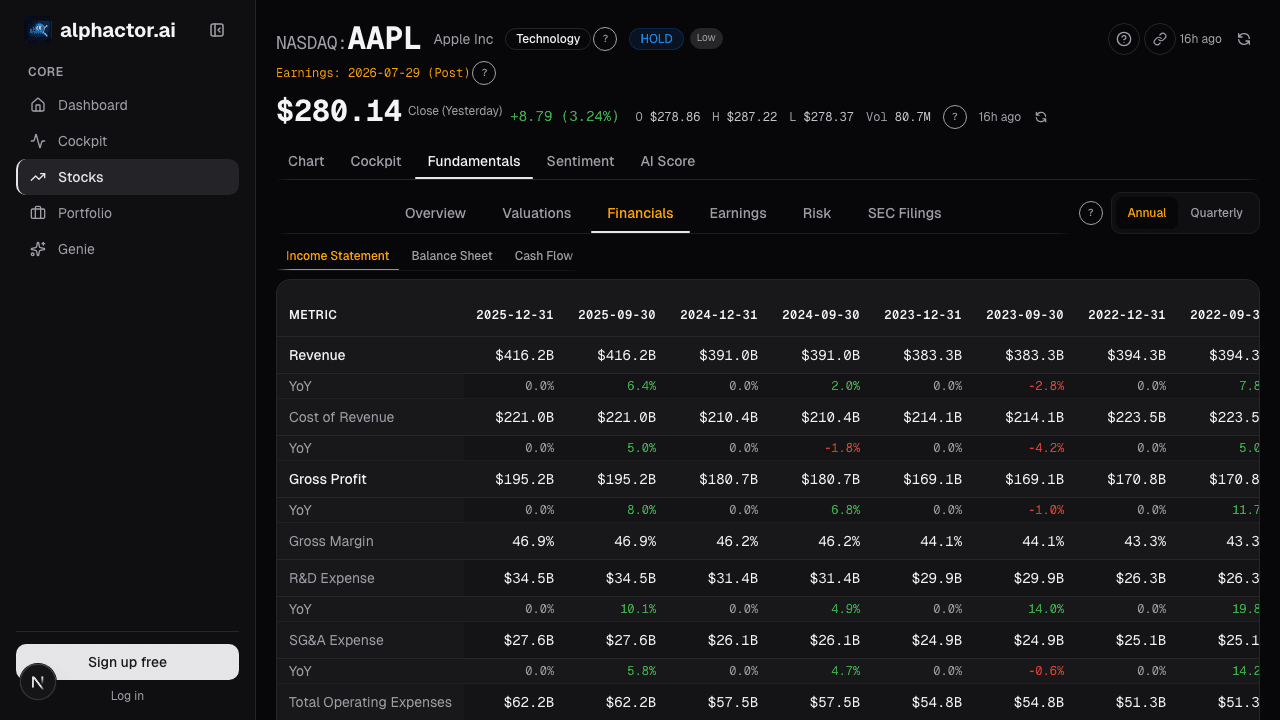
Open the F-Score card → /app/stocks/AAPL/fundamentals
See it in the app
Live dashboard views that match this post. Each tile deep-links to the exact card.


Stocks mentioned
Related reading
Accruals Quality: How to Spot Earnings That Aren't Real
Accruals measure the gap between reported earnings and actual cash. Widening accruals is one of the most reliable red flags in financial analysis, Sloan's…
Altman Z-Score: A Bankruptcy Predictor That Still Works
Edward Altman's 1968 discriminant model predicts bankruptcy within two years about 72% of the time at its distress threshold.
Balance Sheet Deep Dive
Balance sheet changes lead income statements by 2-6 quarters. Net debt, receivables days, and goodwill are the lines that move stocks first.
Price-to-Book Value: Useful for Banks, Misleading for Tech
Price-to-book works for banks and asset-heavy industrials but misleads for software. Here is how to apply it correctly by sector and when to skip it.
Return on Equity
How to use ROE to identify high-quality businesses, why the DuPont decomposition matters, and the leverage trap that inflates the metric.
Ready to try alphactor.ai?
Validate your trading strategies with statistical credibility testing. Start free.
Get Started Free