Part of: Fundamental Analysis
Return on Equity
How to use ROE to identify high-quality businesses, why the DuPont decomposition matters, and the leverage trap that inflates the metric.
 Sarah Patel4 min read
What ROE Tells You
Return on equity measures how efficiently a company turns shareholders' capital into profit. The formula is simple: net income divided by shareholders' equity. A company earning $500 million on $2.5 billion of equity delivers a 20% ROE.
That 20% means every dollar of equity generates 20 cents of annual profit. Over time, companies that sustain high ROE compound shareholder wealth at rates that leave average businesses far behind. Warren Buffett has repeatedly cited ROE as one of his most important quality metrics, and the data supports him. Companies maintaining ROE above 15% over a decade tend to dramatically outperform the broad market.
But the headline number is only the beginning.
The DuPont Decomposition
ROE can be broken into three components, a framework developed at DuPont Corporation nearly a century ago and still used daily by professional analysts:
ROE = Net Profit Margin x Asset Turnover x Equity Multiplier
Each component tells a different story:
- Net profit margin (net income / revenue) measures how much of each sales dollar becomes profit. High margins suggest pricing power, operational efficiency, or both.
- Asset turnover (revenue / total assets) measures how efficiently the company uses its asset base to generate sales. Retailers and distributors tend to score high here.
- Equity multiplier (total assets / shareholders' equity) measures financial leverage. A higher multiplier means more debt relative to equity.
This decomposition matters because a 20% ROE driven by fat margins is fundamentally different from a 20% ROE driven by heavy leverage. The first reflects business quality. The second reflects financial engineering and carries risk.
The Leverage Trap
Consider two companies, both showing 18% ROE. Company A has 12% net margins, moderate asset turnover, and minimal debt. Company B has 5% net margins, similar turnover, but an equity multiplier of 4x because it has loaded up on debt.
In good times, both look identical on ROE. In a recession, Company A's margins might compress to 8% and its ROE drops to 12%. Company B's margins compress to 2%, and after servicing its debt, ROE collapses to 3% or goes negative. Same headline metric, wildly different risk profiles.
This is why you should never screen for high ROE without also checking debt-to-equity. A stock screener that surfaces 25% ROE and 3x debt-to-equity is showing you a leveraged bet, not a quality business.
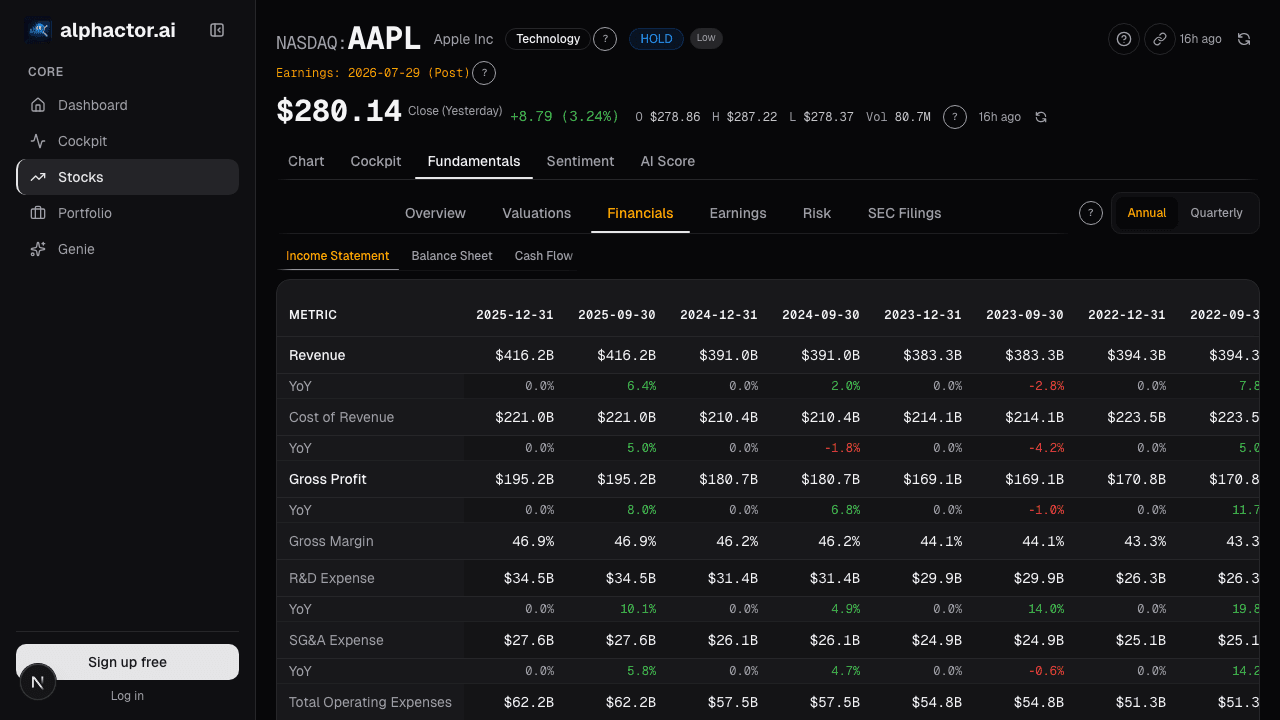
Alphactor's fundamentals view shows ROE alongside the DuPont components and debt metrics, so you can immediately see whether the return is coming from operational strength or balance sheet leverage.
What Good Looks Like
Across the S&P 500, median ROE typically ranges from 13-17%. Sustained ROE above 20% puts a company in elite territory. Here is what different ranges generally indicate:
- Below 8%: The company is not earning its cost of equity. Capital would generate better returns elsewhere.
- 8-15%: Adequate but not exceptional. Common among capital-intensive businesses like industrials and utilities.
- 15-25%: Strong. Indicates competitive advantages, whether from brand, scale, network effects, or intellectual property.
- Above 25%: Exceptional, but verify the source. Some of the highest ROE figures come from companies with negative book equity due to accumulated buybacks (like McDonald's or Boeing), which technically makes the metric meaningless.
The most informative use of ROE is tracking its trajectory over 5-10 years. A company maintaining 18-22% ROE across business cycles is demonstrating durable competitive advantage. One that swings between 5% and 25% is telling you the business is cyclical and the moat is shallow.
ROE vs. ROIC
Return on invested capital (ROIC) is ROE's more sophisticated cousin. While ROE looks at equity returns, ROIC measures returns on all capital, both equity and debt. It uses operating profit (NOPAT) divided by total invested capital.
ROIC is harder to inflate with leverage because adding debt increases both the numerator (if the borrowed capital generates returns) and the denominator (total capital). A company with 15% ROIC is generating strong returns regardless of how it is financed.
For most investors, using ROE and ROIC together provides the clearest picture. High ROE with high ROIC confirms the business is genuinely productive. High ROE with mediocre ROIC reveals that leverage, not operational excellence, is doing the heavy lifting.
Practical Application
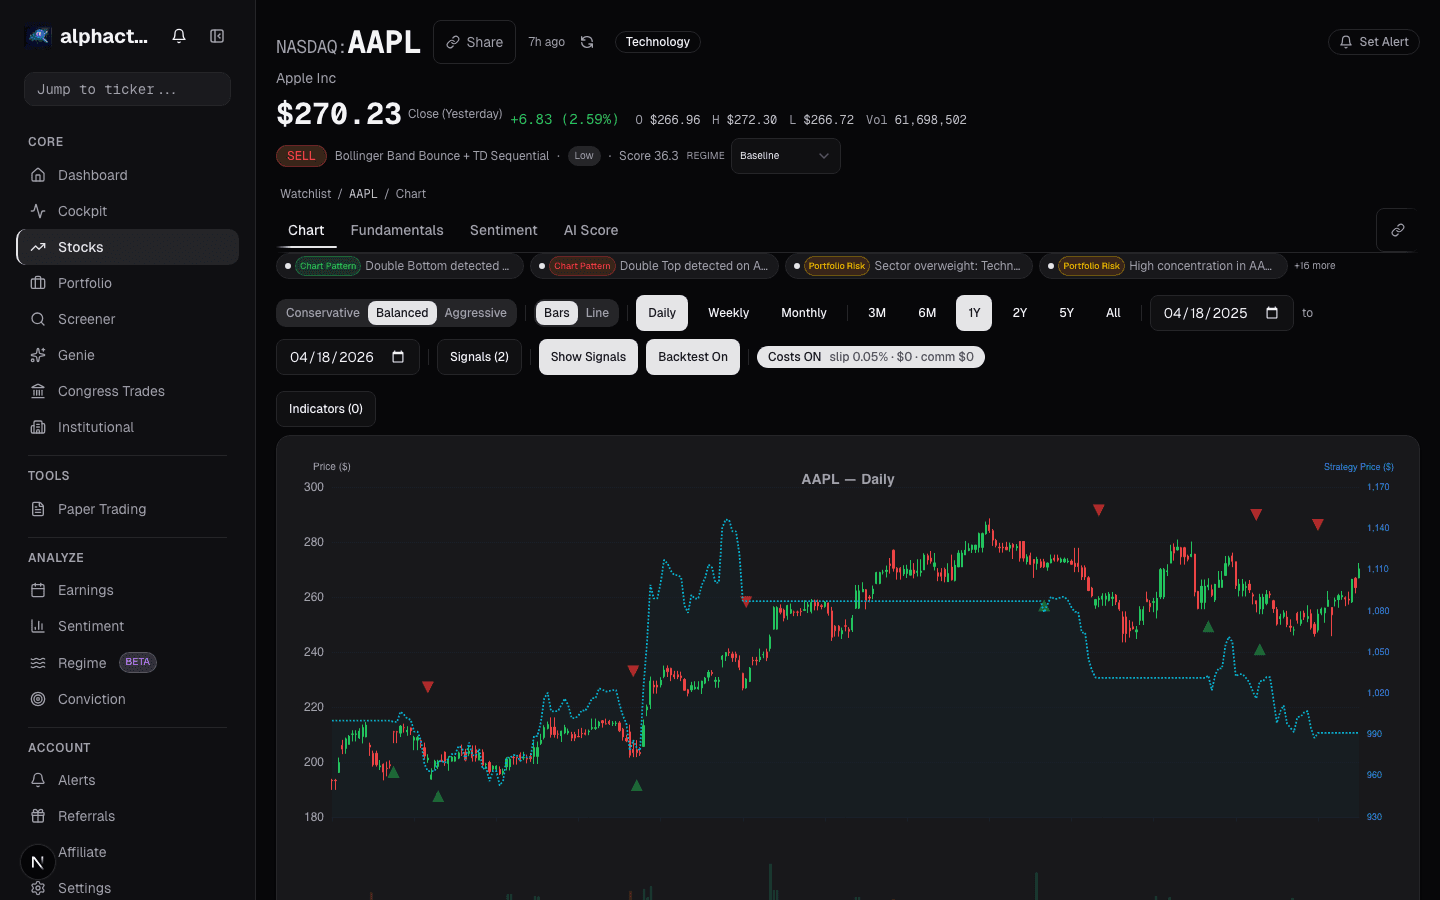
When evaluating a stock, pull up its ROE history over at least five years. On Alphactor, the fundamentals view plots this trend alongside peer medians. Ask three questions: Is ROE consistently above the cost of equity (roughly 8-10% for most companies)? Is it driven by margins and turnover rather than leverage? Is it stable or improving, not deteriorating?
Companies that pass all three tests are disproportionately likely to deliver strong long-term returns. They compound capital effectively, maintain competitive positions, and generate the cash flows that ultimately drive stock prices.
See it in the app
Live dashboard views that match this post. Each tile deep-links to the exact card.


Stocks mentioned
Related reading
Accruals Quality: How to Spot Earnings That Aren't Real
Accruals measure the gap between reported earnings and actual cash. Widening accruals is one of the most reliable red flags in financial analysis, Sloan's…
Altman Z-Score: A Bankruptcy Predictor That Still Works
Edward Altman's 1968 discriminant model predicts bankruptcy within two years about 72% of the time at its distress threshold.
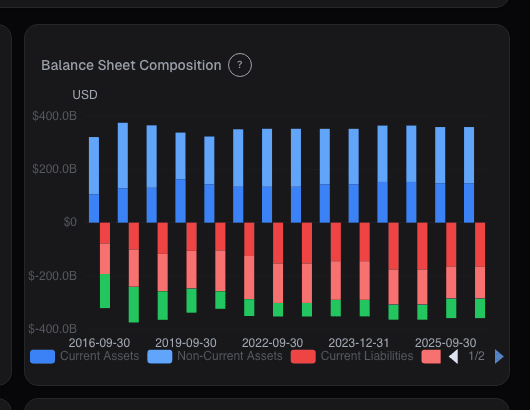
Balance Sheet Deep Dive
Balance sheet changes lead income statements by 2-6 quarters. Net debt, receivables days, and goodwill are the lines that move stocks first.
Price-to-Book Value: Useful for Banks, Misleading for Tech
Price-to-book works for banks and asset-heavy industrials but misleads for software. Here is how to apply it correctly by sector and when to skip it.
Piotroski F-Score
Piotroski's 9 tests filter the value quintile for fundamental improvement. F-scores of 8-9 produced a 72% forward win rate; scores of 0-3 produced only 15%.
Ready to try alphactor.ai?
Validate your trading strategies with statistical credibility testing. Start free.
Get Started Free