Part of: Fundamental Analysis
Price-to-Book Value: Useful for Banks, Misleading for Tech
Price-to-book works for banks and asset-heavy industrials but misleads for software. Here is how to apply it correctly by sector and when to skip it.
 Sarah Patel4 min read
A Metric with a Split Personality
Price-to-book value (P/B) divides a company's market capitalization by its book value, the net assets on its balance sheet (total assets minus total liabilities). A P/B of 1.0 means the market values the company at exactly what its accountants say it is worth. Below 1.0, you are theoretically buying assets for less than their stated value. Above 1.0, you are paying a premium for intangible value the balance sheet does not capture.
The ratio made Benjamin Graham famous. His strategy of buying stocks below book value, paying less than liquidation value, generated strong returns for decades. But applying Graham's approach to the modern market without adjustment is a recipe for confusion. The economy has changed, and P/B has not kept up.
Why P/B Works for Financials
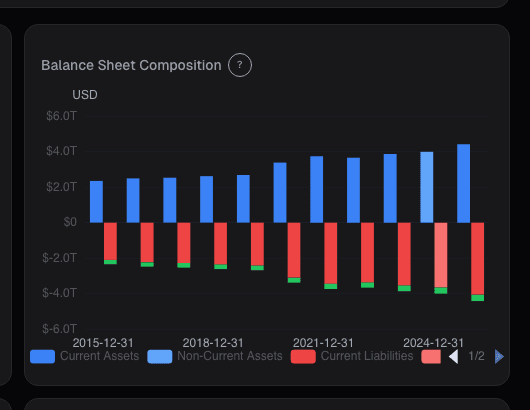
Banks are balance sheet businesses. They take in deposits (liabilities), make loans (assets), and earn the spread. A bank's book value directly reflects the economic substance of its business: the loans, securities, and reserves on its balance sheet.
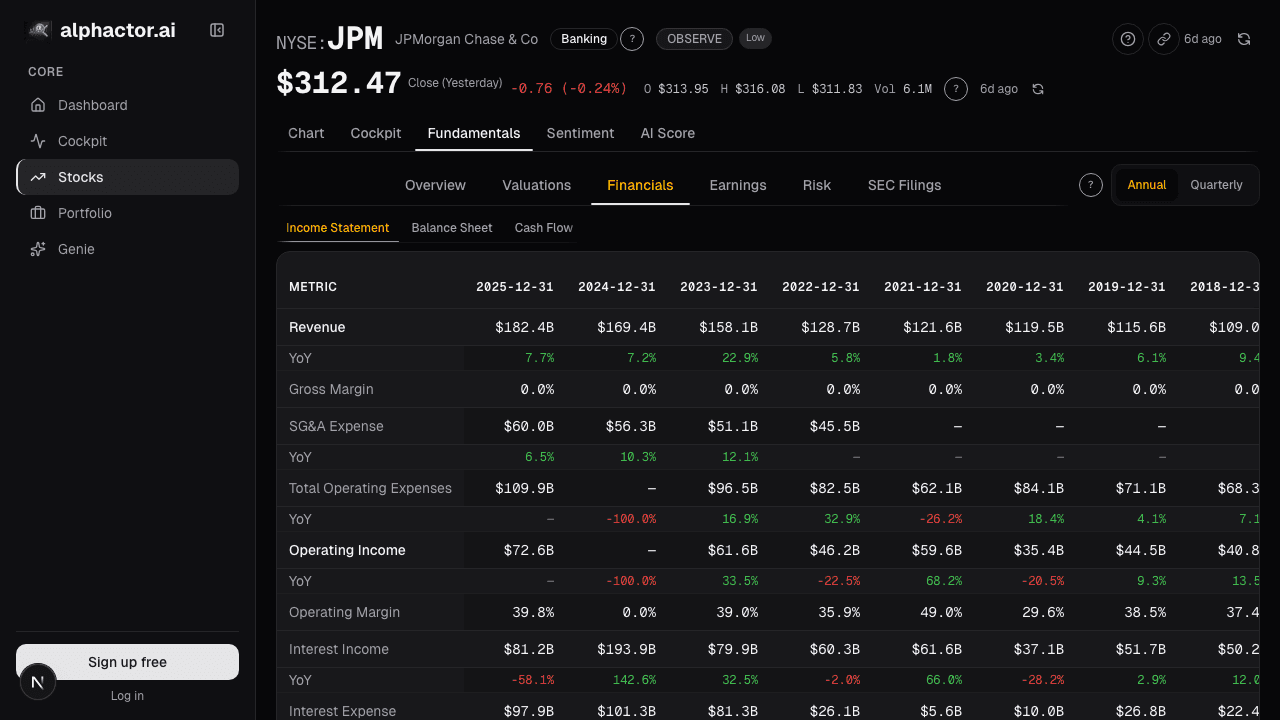
When JPMorgan Chase trades at 1.8x book value and a regional bank trades at 0.9x book, that spread tells you something meaningful. The market believes JPMorgan's assets are higher quality, its earning power is stronger, and it deserves a premium. The regional bank at 0.9x may be hiding unrealized losses, facing credit quality issues, or simply earning inadequate returns on its equity.
For banks, P/B tracks closely with return on equity. A bank earning 15% ROE will trade at a premium to book. A bank earning 5% ROE, below its cost of equity, will trade at a discount. The relationship is tight and reliable.
Insurance companies, asset managers, and other financial institutions follow similar logic. Their assets are mostly financial instruments with observable market values, making book value a reasonable approximation of what the business is actually worth.
Why P/B Fails for Technology
Now consider Microsoft. Its balance sheet shows perhaps $250 billion in net assets. Its market capitalization exceeds $3 trillion. That implies a P/B ratio above 12x. Does this mean Microsoft is wildly overvalued?
Not even close. The discrepancy exists because Microsoft's most valuable assets, its software, its brand, its customer relationships, its installed base of 1.5 billion Windows users, do not appear on the balance sheet. Accounting rules require most internally developed intangible assets to be expensed as incurred, not capitalized. Decades of R&D spending, which created Azure, Office 365, and LinkedIn's network, show up as historical expenses, not as assets.
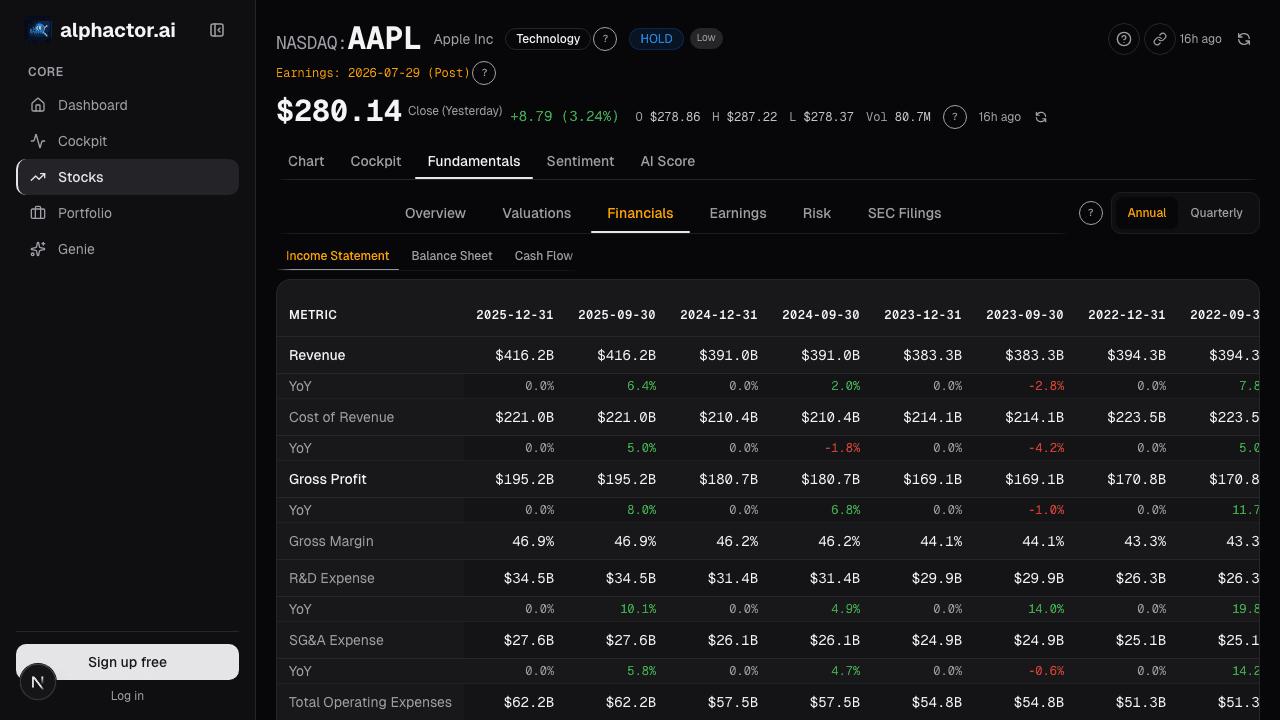
This is not a Microsoft-specific problem. It applies to the entire knowledge economy. Apple, Google, Meta, and virtually every technology, pharmaceutical, and services company derive the majority of their value from assets that accounting standards refuse to recognize on the balance sheet.
Using P/B to evaluate these companies is not just unhelpful. It is actively misleading. It will consistently flag the best businesses in the world as "expensive" while steering you toward asset-heavy, low-return businesses that happen to have low P/B ratios.
Negative Book Value: The Ratio Breaks Entirely
Some companies have negative book equity, meaning total liabilities exceed total assets. McDonald's, Starbucks, and Boeing have all carried negative book value at various points due to aggressive share buybacks funded by debt. When book value is negative, P/B becomes mathematically meaningless.
Does negative book equity mean these companies are worthless? Obviously not. McDonald's generates over $8 billion in annual free cash flow. Its brand alone is worth multiples of its balance sheet. The accounting framework simply cannot capture this reality.
Where P/B Still Adds Value
Beyond financials, P/B retains some utility in specific situations:
Asset-heavy industrials. Companies owning physical assets like factories, mines, pipelines, or real estate have book values that bear some relationship to economic reality. A steel producer at 0.7x book might be genuinely undervalued if the underlying plant and equipment would cost more to replace.
Turnaround and cyclical situations. When a company is temporarily losing money, P/E becomes useless. P/B can serve as a floor estimate. At the bottom of a commodity cycle, energy and materials companies often trade near or below book value. If you believe the cycle will turn, P/B provides a reference point for downside risk.
A Practical Approach
Use P/B as a primary valuation metric for banks and financial institutions. On Alphactor, the stock comparison tool plots P/B against ROE for financial sector stocks, which is the most informative pairing for these businesses. A bank trading at 1.5x book with 14% ROE may be more attractive than one at 0.8x book with 4% ROE, because the discount on the second reflects poor earning power rather than a bargain.
For non-financial companies, P/B should be at most a secondary metric. Prefer EV/EBITDA, price-to-free-cash-flow, or price-to-sales depending on the business model. Alphactor's fundamentals view surfaces the right valuation metrics for each sector. If you do reference P/B for a tech or services company, recognize that you are looking at accounting book value, which bears almost no relationship to the company's actual economic worth.
The broader lesson is that no single valuation metric works everywhere. Financial analysis requires matching the right tool to the right business. P/B is a powerful tool, but only when pointed at the right target.
See it in the app
Live dashboard views that match this post. Each tile deep-links to the exact card.

Stocks mentioned
Related reading
How to Analyze Tech Stocks
The financial metrics that separate winning tech investments from hype-driven traps, with frameworks for evaluating SaaS, hardware, and platform businesses.
DCF vs Multiples: When to Use Each Valuation Method
When discounted cash flow analysis works, when relative multiples are better, and the pitfalls that trip up both approaches.
The Dividend Yield Trap: When High Yield Signals Danger
Why chasing the highest dividend yields is one of the most common mistakes income investors make, and how to identify sustainable dividends.
EV/EBITDA: What Professionals Use Instead of P/E
Why enterprise value to EBITDA is the preferred valuation metric on Wall Street, how to calculate it, and when it gives a clearer picture than P/E.
EV/Revenue: The Multiple That Survives When Earnings Don't
EV/Revenue survives where P/E breaks, but needs a growth bridge. Pre-profit software mid-cycle runs 0.2-0.4x growth-adjusted, how to avoid the reading traps.
FCF Yield: What You're Actually Earning Today
FCF yield answers the most basic question in equity investing: if I buy this company today, how much cash does it throw off per dollar?
Ready to try alphactor.ai?
Validate your trading strategies with statistical credibility testing. Start free.
Get Started Free