Part of: Fundamental Analysis
EV/EBITDA: What Professionals Use Instead of P/E
Why enterprise value to EBITDA is the preferred valuation metric on Wall Street, how to calculate it, and when it gives a clearer picture than P/E.
 Sarah Patel4 min read
Why P/E Falls Short
Price-to-earnings is the first ratio most investors learn and, for many, the last one they use. That is a problem. P/E only looks at equity value and net income, both of which can be distorted by capital structure, tax strategies, and accounting choices. A company that loads up on debt to buy back shares can compress its P/E without improving its business at all.
Enterprise Value to EBITDA solves several of these problems at once. It is the metric you will find in virtually every sell-side research note and M&A analysis, and there is a reason for that.
What EV/EBITDA Actually Measures
Enterprise Value (EV) represents the total price tag of a business: market capitalization plus total debt minus cash. Think of it as the check you would write to buy the entire company outright and settle all its obligations.
EBITDA, earnings before interest, taxes, depreciation, and amortization, approximates the operating cash flow generated by the core business before capital structure and accounting decisions enter the picture.
Dividing EV by EBITDA tells you how many years of current operating cash flow it would take to pay for the entire enterprise. A company with an EV of $10 billion and EBITDA of $2 billion trades at 5x. One with the same EV but $500 million in EBITDA trades at 20x. That spread tells you something about growth expectations, risk, and the market's confidence in future cash generation.
Where EV/EBITDA Beats P/E
Capital structure neutrality. Two identical businesses, one funded entirely by equity and the other carrying $2 billion in debt, will show different P/E ratios because interest expense reduces net income. EV/EBITDA strips that out. This is why it dominates in M&A analysis, where buyers evaluate the business independent of how the current owner chose to finance it.
Cross-border comparisons. Tax rates differ dramatically across jurisdictions. A company domiciled in Ireland with a 12.5% effective rate looks artificially cheap on P/E versus a U.S. peer at 21%. EBITDA is pre-tax, removing that distortion.
Capital-intensive industries. In sectors like telecom, energy, and industrials, depreciation and amortization are massive line items that reduce net income but do not represent cash leaving the business. AT&T's $20 billion in annual depreciation makes its P/E look stretched, but EV/EBITDA tells a more balanced story about operating economics.
Typical Ranges by Sector
Like any multiple, EV/EBITDA only makes sense in context. As of mid-2025, rough sector benchmarks look like this:
- Software/SaaS: 20-35x (high margins, recurring revenue, strong growth)
- Healthcare: 12-20x (wide range from mature pharma to biotech)
- Industrials: 8-14x (cyclical, capital-heavy)
- Energy: 4-8x (commodity-driven, volatile cash flows)
- Utilities: 8-12x (regulated, stable, low growth)
- Retail: 7-12x (thin margins, competitive pressure)
A software company at 25x and a utility at 10x are not telling you one is overvalued and the other cheap. They reflect different business models, growth profiles, and risk characteristics. Compare within sector and against the company's own historical range.
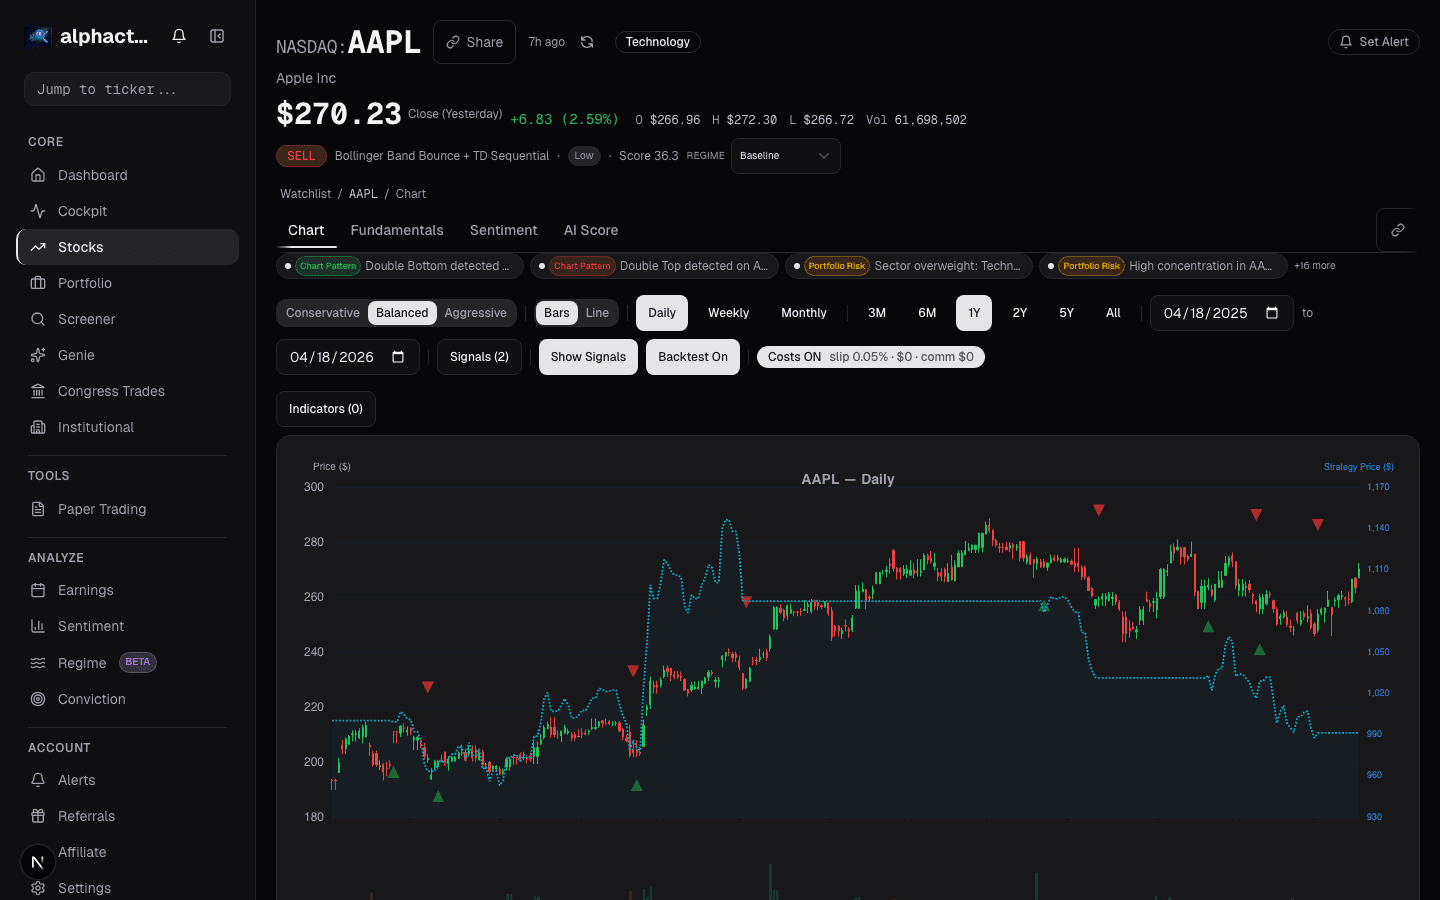
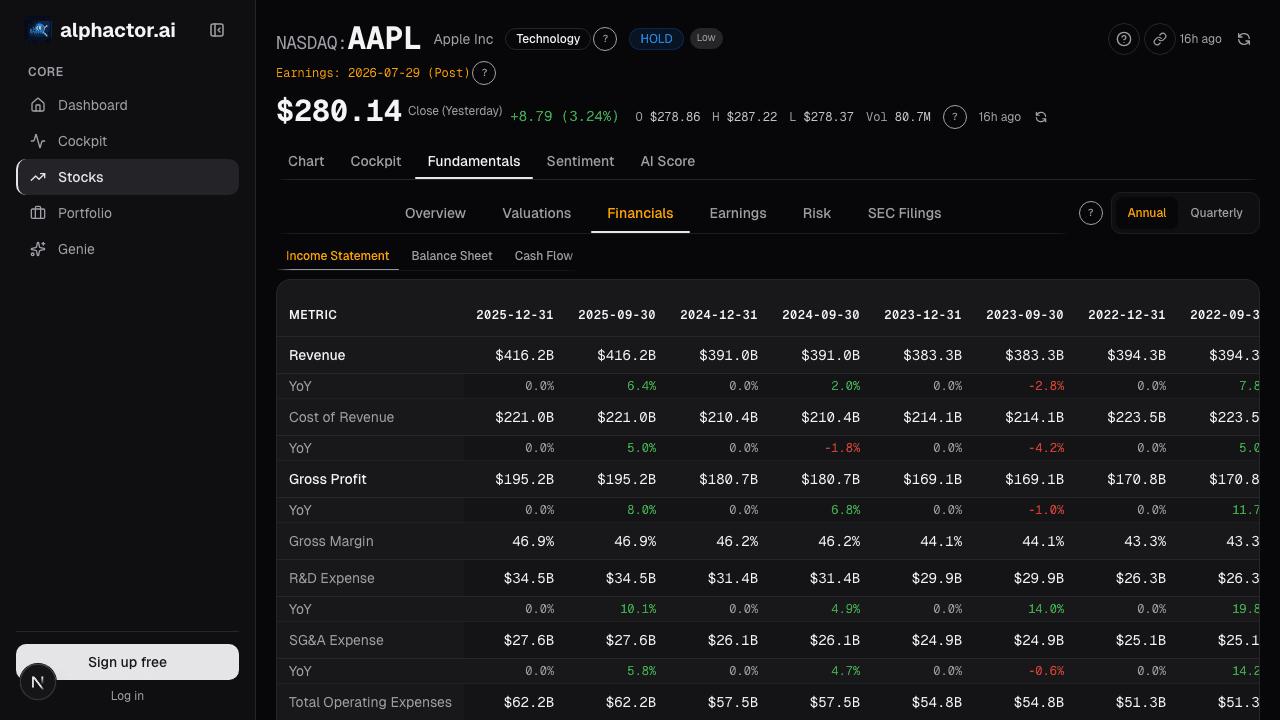
Alphactor's fundamentals view plots EV/EBITDA against sector peers and shows the historical trend, making it straightforward to spot when a stock has drifted outside its normal valuation band.

Known Limitations
EBITDA is not free cash flow. It ignores capital expenditures, working capital changes, and stock-based compensation. A company with $1 billion in EBITDA but $900 million in required capex is not throwing off much actual cash. This is particularly relevant for telecom and infrastructure businesses where maintenance capex is non-discretionary.
EBITDA can also be manipulated. Companies can capitalize operating expenses, reclassify costs, or use aggressive revenue recognition to inflate the number. Always cross-reference EBITDA with actual cash flow from operations.
For companies with minimal debt and straightforward accounting, P/E works fine. You do not need EV/EBITDA to value Berkshire Hathaway or a small-cap with zero debt. The metric earns its keep when comparing companies with different capital structures, different tax situations, or heavy depreciation loads.
How to Use It in Practice
Start by screening for stocks with EV/EBITDA below their sector median. On Alphactor, the stock comparison tool ranks companies within their industry group on this metric. A stock at 8x in a sector averaging 12x deserves investigation.
Then ask why the discount exists. Sometimes the market is right: the company is losing share, facing regulatory risk, or burning cash on failed projects. But occasionally the discount reflects short-term noise, a bad quarter, management turnover, or sector rotation, and the underlying business remains sound. That gap between market perception and business reality is where returns come from.
Pair EV/EBITDA with free cash flow yield, return on invested capital, and revenue growth to build a complete picture. No single metric tells the whole story, but EV/EBITDA is a better starting point than most.
See it in the app
Live dashboard views that match this post. Each tile deep-links to the exact card.

Stocks mentioned
Related reading
Price-to-Book Value: Useful for Banks, Misleading for Tech
Price-to-book works for banks and asset-heavy industrials but misleads for software. Here is how to apply it correctly by sector and when to skip it.
EV/Revenue: The Multiple That Survives When Earnings Don't
EV/Revenue survives where P/E breaks, but needs a growth bridge. Pre-profit software mid-cycle runs 0.2-0.4x growth-adjusted, how to avoid the reading traps.
FCF Yield: What You're Actually Earning Today
FCF yield answers the most basic question in equity investing: if I buy this company today, how much cash does it throw off per dollar?
Earnings Power Value
EPV asks what a company is worth assuming zero growth, forever. The gap between EPV and market cap is the growth premium.
Understanding P/E Ratio: A Complete Guide for Investors
Learn what the P/E ratio means, how to interpret it, and when it can mislead you. Includes sector comparisons and practical examples.
Ready to try alphactor.ai?
Validate your trading strategies with statistical credibility testing. Start free.
Get Started Free