Part of: Fundamental Analysis
Understanding P/E Ratio: A Complete Guide for Investors
Learn what the P/E ratio means, how to interpret it, and when it can mislead you. Includes sector comparisons and practical examples.
 Sarah Patel3 min read
What the P/E Ratio Actually Tells You
The Price-to-Earnings ratio is one of the most widely cited metrics in stock analysis, and one of the most commonly misunderstood. At its simplest, P/E divides a company's share price by its earnings per share (EPS). A stock trading at $150 with EPS of $10 has a P/E of 15. That means investors are paying $15 for every $1 of current earnings.
But that single number hides a lot of nuance.
Trailing vs. Forward P/E
Trailing P/E uses the last 12 months of actual reported earnings. It is backward-looking and factual but may not reflect where the business is headed. A company that just had a terrible quarter will show an inflated trailing P/E even if analysts expect a strong recovery.
Forward P/E uses consensus analyst estimates for the next 12 months of earnings. It is forward-looking but depends on analyst accuracy, which varies widely. Forward P/E tends to be lower than trailing P/E for growing companies because analysts project earnings growth.
When comparing P/E ratios, always make sure you are comparing the same type. Mixing trailing and forward P/E is like comparing a sprinter's time from last year with their predicted time for next year.
Why Sector Context Matters
A P/E of 25 means very different things depending on the sector. As of early 2026, typical ranges look roughly like this:
- Technology: 25-40 (high growth expectations justify higher multiples)
- Utilities: 12-18 (stable, slow-growing businesses)
- Financials: 10-15 (cyclical, regulated earnings)
- Healthcare: 18-30 (wide range depending on pipeline vs. mature pharma)
- Consumer Staples: 18-22 (steady demand, moderate growth)
Comparing a tech stock's P/E to a utility company's P/E is meaningless. The real question is: how does this stock's P/E compare to its sector peers and its own historical range?
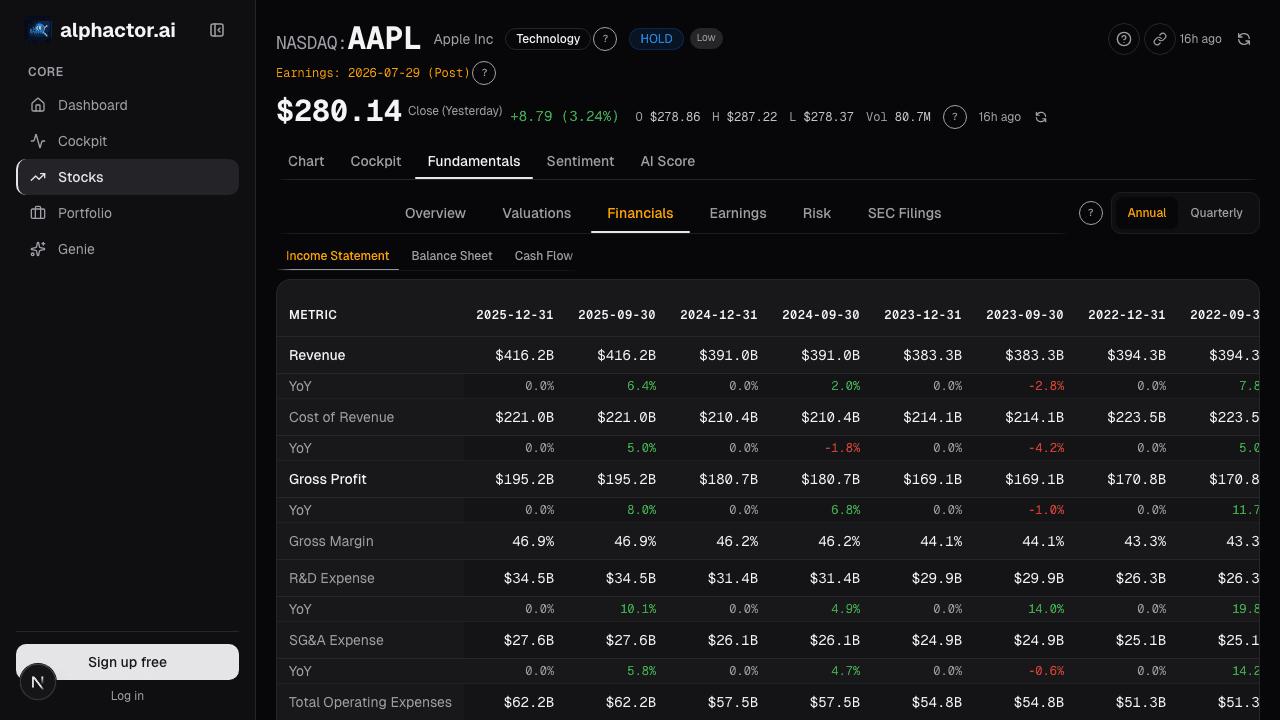
On the fundamentals view, peer comparison charts plot a stock's valuation metrics against its sector median, making this context immediately visible.
When P/E Misleads
P/E has several well-known blind spots:
Negative earnings break the ratio. A company with negative EPS has no meaningful P/E. Early-stage growth companies, turnaround situations, and cyclical businesses at the bottom of their cycle all fall into this bucket. For these, price-to-sales or EV/EBITDA may be more useful.
Earnings manipulation is possible. Companies can use accounting choices (depreciation methods, revenue recognition timing, one-time charges) to shift earnings between quarters. A suspiciously smooth earnings history might warrant a look at cash flow instead.

Growth rate is invisible. A stock with a P/E of 40 growing earnings at 50% annually may be cheaper than a stock with a P/E of 15 growing at 2%. This is where the PEG ratio comes in.
The PEG Ratio: P/E's Smarter Cousin
The Price/Earnings-to-Growth ratio divides P/E by the expected earnings growth rate. A stock with a P/E of 30 and 30% projected growth has a PEG of 1.0. Generally:
- PEG below 1.0 suggests the stock may be undervalued relative to its growth
- PEG around 1.0 suggests fair valuation
- PEG above 2.0 suggests the market is pricing in very optimistic assumptions
PEG is not perfect either. It assumes linear growth and depends on the accuracy of growth estimates. But it adds a dimension that raw P/E lacks.
How to Use P/E in Practice
A practical approach to using P/E in your analysis:
- Compare within sector. Use peer groups, not the broad market, as your benchmark.
- Look at the historical range. If a stock typically trades at 15-20x earnings and is currently at 30x, ask what changed. Is growth accelerating, or is the market getting ahead of itself?
- Cross-reference with cash flow. If P/E tells one story but price-to-free-cash-flow tells another, dig deeper.
- Combine with other metrics. P/E is a starting point, not a conclusion. Layer it with revenue growth, margins, return on equity, and debt levels to build a complete picture.
- Use PEG for growth stocks. When a high P/E stock tempts you to dismiss it as overpriced, check the PEG first.
Putting It Together
P/E is a useful shorthand for how the market values a company's earnings, but it is never the full story. The best analysts use it as one input among many, always viewed in context. Sector, growth rate, earnings quality, and historical norms all matter.
The fundamentals view lets you see P/E alongside dozens of other metrics, compare across peers, and track how valuation has changed over time, so you can make informed decisions instead of relying on a single number.

See it in the app
Live dashboard views that match this post. Each tile deep-links to the exact card.

Stocks mentioned
Related reading
Price-to-Book Value: Useful for Banks, Misleading for Tech
Price-to-book works for banks and asset-heavy industrials but misleads for software. Here is how to apply it correctly by sector and when to skip it.
EV/EBITDA: What Professionals Use Instead of P/E
Why enterprise value to EBITDA is the preferred valuation metric on Wall Street, how to calculate it, and when it gives a clearer picture than P/E.
EV/Revenue: The Multiple That Survives When Earnings Don't
EV/Revenue survives where P/E breaks, but needs a growth bridge. Pre-profit software mid-cycle runs 0.2-0.4x growth-adjusted, how to avoid the reading traps.
FCF Yield: What You're Actually Earning Today
FCF yield answers the most basic question in equity investing: if I buy this company today, how much cash does it throw off per dollar?
Earnings Power Value
EPV asks what a company is worth assuming zero growth, forever. The gap between EPV and market cap is the growth premium.
Ready to try alphactor.ai?
Validate your trading strategies with statistical credibility testing. Start free.
Get Started Free