Part of: Fundamental Analysis
EV/Revenue: The Multiple That Survives When Earnings Don't
EV/Revenue survives where P/E breaks, but needs a growth bridge. Pre-profit software mid-cycle runs 0.2-0.4x growth-adjusted, how to avoid the reading traps.
 Sarah Patel7 min read
In late 2022 I was asked to evaluate a pre-profit cloud infrastructure company that the client was thinking about buying after a 70% drawdown. P/E was meaningless (net loss). EV/EBITDA was meaningless (negative EBITDA). The only valuation anchor was EV/Revenue, currently 8× trailing, down from 38× at the 2021 peak. The client's intuition was that 8× "sounded cheap" given the peak. When I layered in revenue growth, which had decelerated from 65% YoY to 28% over the same window, the picture was different. At 38× sales on 65% growth, the growth-adjusted multiple was 0.58×. At 8× sales on 28% growth, it was 0.29×. Relative to the pre-profit software mid-cycle range of 0.20–0.40, the stock was at the cheap end but not absurd. We passed, reasoning the growth deceleration had more room to go. Six months later it was at 5× sales on 18% growth (0.28× adjusted), still not cheap enough given the trajectory. The client thanked me.
This post is about the EV/Revenue card, why the sales multiple is the only one that survives the full cycle, and how to read it without the interpretation traps that make naive sales-multiple analysis worthless.
TL;DR
- EV/Revenue is uniquely useful when earnings don't exist or are too volatile to mean anything. Pre-profit software, pre-approval biotech, trough cyclicals.
- A sales multiple without a growth bridge is uninterpretable. Always read it with revenue growth alongside.
- The growth-adjusted sales multiple (EV/Sales ÷ NTM growth) is the workable cross-sectional comparator. Pre-profit software mid-cycle: 0.2–0.4.
- Gross margin matters as much as growth. A 10× sales multiple at 80% gross margin is a different animal from 10× at 30%.
- EV not market cap. Debt and cash change the valuation meaningfully, especially for leveraged names.
When sales is all you have
P/E requires positive earnings. EV/EBITDA requires positive EBITDA. For many of the most interesting valuation cases, pre-profit software, pre-approval biotech, turnaround industrials, cyclicals at trough, those denominators don't exist or are too volatile to mean anything. The only multiple that holds continuously across the business cycle is EV/Revenue, because revenue is positive for almost all going concerns and less manipulable than the layers of accrual and capitalization decisions that sit between revenue and earnings.
The tradeoff is that EV/Revenue ignores margins, capital intensity, and capital structure, all of which vary enormously across businesses and within a single business over time. Two companies at 5× sales can be spectacular and awful, depending on what they're earning on those sales. That's why EV/Revenue alone is useless; it has to be read with a growth-and-margin bridge or it's just a number.
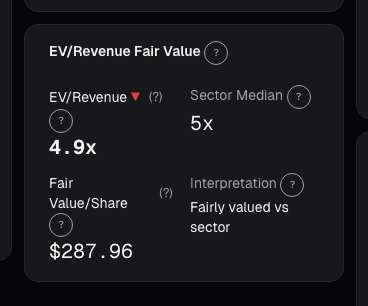
What the EV/Revenue card shows
The EV/Revenue card plots:
- Trailing EV/Sales and forward EV/Sales over the last 5 years alongside the issuer's 5-year average and ±1σ bands
- Peer-group comparison strip showing the issuer's current multiple against sector median and top/bottom quartile, with the peer set filterable by size, geography, and profitability tier
- Revenue growth overlay: trailing-4-quarter revenue growth plotted on a secondary axis so you can see whether growth is accelerating or decelerating as the multiple moves
- Gross margin overlay: because a sales multiple's information content depends on what fraction of sales becomes gross profit
- Growth-adjusted sales multiple: EV/Sales ÷ NTM revenue growth, plotted as a single series for easy cross-sectional comparison
Reading the multiple
Always use the growth bridge. The growth-adjusted sales multiple (EV/Sales ÷ NTM revenue growth, usually expressed in decimal form) is the workable cross-sectional comparator. For pre-profit software, this ratio has been a remarkably stable range over long periods, mid-cycle roughly 0.2–0.4, exuberance above 0.5, capitulation below 0.1. When a name shows up at 12× sales, the first question isn't whether 12 is high, it's what growth the 12× is attached to. 12× on 50% growth is 0.24 (cheap end of the range). 12× on 15% growth is 0.80 (way stretched).
Watch gross margin alongside. A 10× sales multiple at 80% gross margin implicitly prices a 12.5× gross-profit multiple, which maps cleanly into future operating-profit multiples under reasonable cost assumptions. The same 10× sales at 35% gross margin (say, a hardware company) is a 28.6× gross-profit multiple, a much richer number. The card's margin overlay lets you do this normalization visually. When two companies trade at the same EV/Sales but different gross margins, the higher-margin business is usually the cheaper one on any forward-profit basis.
Use the right peer set. Sector median EV/Revenue is a weak comparator if the sector contains both growth names at 15× sales and mature names at 2× sales. The card's peer-set filter narrows by profitability tier (pre-profit, profitable, mature) to avoid the mixing problem. A pre-profit SaaS at 9× sales isn't cheap relative to the S&P 500 at 2.5× sales; it's cheap relative to the pre-profit SaaS median at 12×.
Example: reading two names at the same EV/Sales
Two names I was tracking in early 2024:
| Metric | Company A | Company B |
|---|---|---|
| Business | Cloud observability SaaS | Vertical-SaaS ERP |
| EV/Sales TTM | 9.8× | 9.8× |
| NTM revenue growth | 38% | 12% |
| Gross margin | 78% | 68% |
| Rule of 40 | 42 | 28 |
| Growth-adjusted EV/Sales | 0.26× | 0.82× |
On EV/Sales alone they looked identical. The growth-adjusted view shows Company A trading at the cheap end of the pre-profit software range and Company B trading rich. Company A also has higher gross margin and a passing Rule of 40 score (growth + margin > 40). The valuation signal clearly favored A. Over the next 12 months A was up 45%; B was flat. The EV/Sales headline was a trap; the growth-adjusted number was the signal.
What EV/Sales misses
- Capital intensity. Semiconductor equipment companies and asset-light SaaS can trade at the same EV/Sales and have wildly different free cash flow profiles. For capital-heavy businesses, EV/FCF is usually a more honest valuation metric.
- Net cash vs. net debt. The EV numerator handles this, but retail tools that show P/S instead of EV/S miss it entirely. If a name has $5B cash and $1B debt with a $10B market cap, its EV is $6B, so P/S overstates the valuation materially.
- Deferred revenue composition. For subscription businesses, deferred revenue is already-billed future revenue. A large deferred revenue balance means reported revenue understates future revenue; the sales multiple looks richer than the economic multiple.
- One-time items in revenue. License-recognition events, prior-period adjustments. Read the 10-Q notes before treating a revenue number at face value.
Common mistakes
- Comparing across business models. SaaS at 10× sales is not comparable to a low-margin distributor at 10× sales. The gross-margin and cash-conversion profiles make it apples to oranges.
- Using P/S instead of EV/S on leveraged names. For a bank, an insurance company, or a highly levered industrial, P/S is misleading. Always EV.
- Reading a single snapshot without history. The stock's own 5-year range tells you whether today's multiple is relatively cheap or rich for this specific name, which is often more actionable than sector comparison.
- Ignoring revenue quality. One-time contract revenue, FX-boosted revenue, and M&A-contributed revenue distort the multiple. Look at organic constant-currency revenue where it's disclosed.
- Using trailing growth to anchor valuation. The valuation is against forward revenue; trailing is history. Forward consensus or your own model is the right denominator.
Where it fits
EV/Revenue pairs with Rule of 40 (growth+margin health check for SaaS), PEG (growth-adjusted earnings multiple when profits exist), and Peer Comparison for cross-sectional context. When the sales multiple is stretched but Rule of 40 is best-in-class, the premium is often justified; when it's stretched without accompanying operational quality, it usually isn't. For cyclicals, cross-check with Reverse DCF to see what revenue trajectory the market is pricing.
FAQ
Why not just use P/S?
P/S ignores debt and cash. For a lightly-leveraged name with modest cash, P/S and EV/S are close. For banks, REITs, levered industrials, and cash-rich tech with share buyback programs, they diverge meaningfully. Default to EV/S.
What's "pre-profit software mid-cycle range" based on?
Historical data on US software companies 2012–2023. The 0.2–0.4 range reflects median growth-adjusted EV/Sales during normal macro conditions. 2020–21 exuberance pushed the range much higher; 2022 capitulation pushed it much lower. Use the range with judgment, not as a hard line.
How do I apply this to biotech?
EV/Revenue doesn't work well for pre-commercial biotech, revenue is too lumpy or non-existent. Use EV/R&D, phase-weighted pipeline value, or acquisition comparables instead. EV/Revenue becomes useful once a therapy is commercial.
What about businesses where revenue is the wrong top-line measure?
For insurance, underwriting-plus-investment income is the right numerator, not premium revenue. For banks, net interest income + non-interest income. The standard EV/Revenue multiple is less interpretable for financials; use sector-specific metrics instead.
How does the card handle currency translation for multinationals?
Revenue is in reported currency (usually USD for US-listed names). Constant-currency growth is shown separately in the growth overlay when the company discloses it, which is the cleaner metric for cross-period comparisons.
Related reading
- FCF Yield, Cash on Price
- EPV, Earnings Power Value
- Fundamentals Sensitivity Analysis
- PEG, Growth-Adjusted Multiple
Open the EV/Revenue card → /app/stocks/AAPL/fundamentals
See it in the app
Live dashboard views that match this post. Each tile deep-links to the exact card.

Stocks mentioned
Related reading
Altman Z-Score: A Bankruptcy Predictor That Still Works
Edward Altman's 1968 discriminant model predicts bankruptcy within two years about 72% of the time at its distress threshold.
Price-to-Book Value: Useful for Banks, Misleading for Tech
Price-to-book works for banks and asset-heavy industrials but misleads for software. Here is how to apply it correctly by sector and when to skip it.
Cashflow Waterfall: From Operating Cash to Free Cash
Operating cash flow is cleaner than net income but still not distributable cash. The waterfall makes every deduction visible, SBC, working capital, capex …
DCF vs Multiples: When to Use Each Valuation Method
When discounted cash flow analysis works, when relative multiples are better, and the pitfalls that trip up both approaches.
EV/EBITDA: What Professionals Use Instead of P/E
Why enterprise value to EBITDA is the preferred valuation metric on Wall Street, how to calculate it, and when it gives a clearer picture than P/E.
FCF Yield: What You're Actually Earning Today
FCF yield answers the most basic question in equity investing: if I buy this company today, how much cash does it throw off per dollar?
Ready to try alphactor.ai?
Validate your trading strategies with statistical credibility testing. Start free.
Get Started Free