Part of: Fundamental Analysis
Valuation Sensitivity
A DCF prints one number; the truth is a distribution. Swinging WACC by 100 bps and terminal growth by 50 bps routinely moves the output by 40-70%.
 Sarah Patel8 min read
In early 2024 I was evaluating a high-quality consumer-staples name. My DCF printed a fair value of $189 vs. a market price of $176, "8% upside," a point estimate that felt precise enough to act on. Before sizing, I pulled the sensitivity grid. The range across reasonable assumptions, WACC from 7.5% to 9.5%, terminal growth from 2.0% to 3.5%, was from $142 to $247. That's a 70%+ range across assumption sets that I couldn't honestly distinguish between. Under the pessimistic corner of the grid, the stock was 19% overvalued; under the optimistic corner, 40% undervalued. Counting cells, 52% of the grid showed premium and 48% showed discount. That's not "8% upside", that's "fairly priced under most reasonable assumptions, with a skew that's approximately symmetric." The grid changed my action entirely. Instead of a position sized for an asymmetric 8% upside bet, I took a half-sized position acknowledging the call was about 50/50 and sizing for the skew rather than the point estimate. Over the following year the stock returned 11%, close enough to the point estimate to have looked "right" in retrospect, but the grid told me I'd been lucky to hit the upper half of the distribution, not that the model had been precise. That distinction matters for position sizing and for intellectual honesty about what DCF-based valuation can and can't tell you.
This post is about the Sensitivity card, why the grid view is more honest than point-estimate DCFs, and the two reads that turn the grid into actionable information rather than visual clutter.
TL;DR
- Point-estimate DCFs hide assumption risk. A 100-bp WACC shift can move fair value by 40-70%.
- The sensitivity grid shows the full range across reasonable assumption sets.
- Look at corners, not the center. The corner cells reveal whether the call is high-conviction across assumptions or marginal.
- Count cells above vs. below current price to gauge baseline valuation skew.
- Use alongside EPV for the floor and Reverse DCF for the market's implied assumptions.
Why point estimates are misleading
A DCF requires a bundle of forward assumptions, revenue growth path, margin trajectory, WACC, terminal growth rate. Two of those inputs (WACC and terminal growth) have disproportionate leverage because they're compounded across the entire forecast and terminal period. Specifically:
- A 100-bp WACC change routinely moves fair value by 15-25% for typical mature businesses and 30-50% for long-duration growth businesses
- A 50-bp terminal growth change routinely moves fair value by 10-20%, more for high-multiple names
- Combined, a reasonable WACC/terminal range (±150 bps / ±100 bps) can swing fair value by 40-70%
That's not model noise; that's the honest range of outcomes you can't distinguish between at the time you're building the model. The point estimate pretends that precision exists where it doesn't.
What the sensitivity view gives you that a point estimate can't:
- Bounded range: what is the fair value under the most pessimistic reasonable assumption set? Under the most optimistic?
- Conviction read: if the pessimistic corner is still above market price, the call is robust; if only the optimistic corner is, the call depends on being right about assumptions
- Skew: is the distribution of outcomes centered on upside or downside?
- Size calibration: a robust call sized appropriately differs from a marginal call sized appropriately
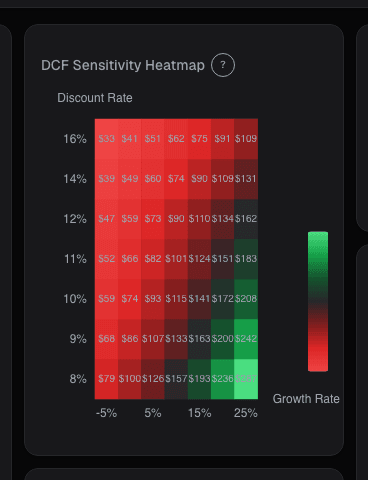
What the Sensitivity card shows
The Sensitivity card renders a color-coded 2D grid of fair-value-per-share across two dimensions:
- Default axes: WACC (±200 bps from computed WACC, in 50 bps steps) and terminal growth rate (0% to 4%, in 50 bps steps)
- Alternative axes: steady-state operating margin vs. revenue growth, for businesses where those are the load-bearing assumptions (SaaS, cyclicals)
- Cell coloring: premium (green) or discount (red) vs. current stock price, with shade intensity indicating magnitude
Key views:
- Grid heatmap: visual scan of where the stock is cheap vs. expensive across assumptions
- Corner summary: the four corner values explicitly highlighted
- Cell count: number and percentage of cells above and below current price
- Current-assumptions marker: shows where your baseline assumption set sits in the grid
- Export to CSV: dump the grid into a spreadsheet for further analysis
- Axis toggle: switch between WACC/terminal, margin/growth, or custom-axis pair
Two reads that turn the grid into action
Look at the corners, not the center. The center cell is just the point estimate in a bigger package, no new information. The corners are where the decision lives:
- Top-left (pessimistic WACC + pessimistic terminal): worst-case fair value. If still above current price, the stock is cheap across almost any reasonable assumption, a robust long.
- Bottom-right (optimistic WACC + optimistic terminal): best-case fair value. If still below current price, the stock is expensive across almost any reasonable assumption, a robust short candidate.
- When all four corners straddle current price: the call depends on exactly which assumptions are right, a marginal call that should be sized small.
Robust calls are rare. Most of the time the grid straddles current price, which means you're not getting a free lunch from valuation alone and you need another catalyst (earnings surprise, multiple re-rating, balance sheet event) to drive the thesis.
Count cells above vs. below current price to gauge skew. A 9×9 grid (81 cells) can be tallied by side:
- > 70% above current price: baseline skew is cheap; position sizing can lean long
- > 70% below current price: baseline skew is expensive; position sizing should lean short or stay out
- 50-50: fairly priced across the assumption distribution; no valuation-based edge, need a separate catalyst
This count is a cleaner read than the headline fair-value number because it accounts for the distribution of possible outcomes, not just the mean. Two stocks with the same point-estimate fair value can have very different grid distributions, one might be "cheap in 85% of cells, expensive in 15%" (robust long) while another is "cheap in 48% of cells, expensive in 52%" (coin flip).
Example: the consumer-staples evaluation
The sensitivity grid snapshot from early 2024:
| Terminal \ WACC | 7.5% | 8.0% | 8.5% | 9.0% | 9.5% |
|---|---|---|---|---|---|
| 3.5% | $247 | $224 | $206 | $190 | $177 |
| 3.0% | $228 | $208 | $193 | $179 | $168 |
| 2.5% | $212 | $195 | $182 | $171 | $162 |
| 2.0% | $198 | $184 | $173 | $163 | $155 |
| 1.5% | $186 | $174 | $164 | $155 | $148 |
Grid summary:
- Current price: $176
- Point-estimate fair value (WACC 9.0%, TG 2.5%): $171, technically below market
- Top-left corner (WACC 7.5%, TG 3.5%): $247 (optimistic fair value)
- Bottom-right corner (WACC 9.5%, TG 1.5%): $148 (pessimistic fair value)
- Range: $148 to $247, a 67% spread
- Cells above $176: 13 of 25 (52%)
- Cells below $176: 12 of 25 (48%)
- Verdict: marginal call, symmetric skew, size accordingly
The point-estimate was actually slightly *below* market ($171 vs. $176), which would have suggested a small short. But the broader grid showed nearly-symmetric distribution with 52% of cells above market price. That's a setup where valuation doesn't give you a clean directional edge, you need a separate thesis reason. I took a small long position (not based on the grid, but based on a separate quality-at-reasonable-price thesis), sized consistent with the "coin-flip on valuation" read rather than the false precision of a $171 point estimate.
What sensitivity can miss
- Margin/growth interactions. A DCF with WACC/terminal sensitivity may miss that the real risk is a margin collapse combined with growth deceleration. The margin/growth axis option addresses this partially.
- Non-linear effects. Some businesses have threshold dynamics (e.g., operating leverage inflecting at a revenue level); linear grids can miss these.
- Scenario coherence. A 9.5% WACC often correlates with a 1.5% terminal growth in real-world scenarios (both reflect risk-off), but the grid treats them as independent. Diagonal reads are more realistic than corner reads.
- Model structure. The grid only varies two inputs; other assumptions (capex intensity, working capital growth, tax rate) are held constant.
- Current price point-in-time. The grid colors are based on today's price; tomorrow's grid with the same fair values might color differently.
Common mistakes
- Ignoring the grid and reading only the point estimate. The single cell is less informative than the whole grid.
- Treating the grid as equiprobable. The center of the grid is more likely than the corners; corner cases are tail outcomes.
- Building the grid around a biased baseline. If your starting WACC and terminal are already biased, the whole grid inherits the bias.
- Over-reading 5-cell clusters. Small cluster patterns in the grid are often artifacts of the step size.
- Forgetting that valuation isn't everything. A stock can be cheap on the grid and still fall because of earnings disappointment, management change, or macro shocks.
Where it fits
Sensitivity is the honest anchor for every other valuation card. Pair with the base DCF for the point-estimate baseline, the Reverse DCF for the implied-growth framing, and EPV for the no-growth floor. Combined, you get: the floor (EPV), the point estimate (DCF), the implied expectations (Reverse DCF), and the sensitivity around the point estimate. That quartet is most of what honest equity valuation can tell you.
FAQ
What axis should I pick?
Default WACC/terminal is the right start for most businesses. Switch to margin/growth for SaaS and cyclicals where operating leverage dominates.
Can I customize the ranges?
Yes, override the WACC center, terminal range, and step size. Useful for very stable businesses (tighter grid) or highly speculative ones (wider grid).
How do I think about corner-case realism?
Corner cases combine two independent extreme assumptions. In reality, they're often correlated (high WACC with low growth, low WACC with high growth). Diagonal cells are more realistic than corner cells for real-world scenario-thinking.
Why default ±200 bps for WACC?
Covers the range of reasonable WACC estimates for most US large-caps. High-risk or rate-sensitive names may need ±300 bps; very stable names can use ±100 bps.
Does the grid account for dividends and buybacks?
Only if they're reflected in the FCF projection. Shareholder yield-driven valuations need their own adjustment.
Related reading
- EV/Revenue and Sales Multiple
- FCF Yield, Cash on Price
- Fundamentals EPV, Earnings Power
- PEG, Growth-Adjusted Multiple
Open the Sensitivity card → /app/stocks/AAPL/fundamentals
See it in the app
Live dashboard views that match this post. Each tile deep-links to the exact card.

Stocks mentioned
Related reading
Price-to-Book Value: Useful for Banks, Misleading for Tech
Price-to-book works for banks and asset-heavy industrials but misleads for software. Here is how to apply it correctly by sector and when to skip it.
EV/Revenue: The Multiple That Survives When Earnings Don't
EV/Revenue survives where P/E breaks, but needs a growth bridge. Pre-profit software mid-cycle runs 0.2-0.4x growth-adjusted, how to avoid the reading traps.
FCF Yield: What You're Actually Earning Today
FCF yield answers the most basic question in equity investing: if I buy this company today, how much cash does it throw off per dollar?
Earnings Power Value
EPV asks what a company is worth assuming zero growth, forever. The gap between EPV and market cap is the growth premium.
PEG Ratio: A Growth-Adjusted P/E, Less Naive Than It Looks
Naive PEG ignores growth quality and buyback distortions. The fix: use 3-5 year organic EPS CAGR and compare only within a profit-consistent peer group.
Rule of 40: The Shorthand That Captures SaaS Health
The Rule of 40 collapses growth and profitability into a single number that should exceed 40 for a durable SaaS business.
Ready to try alphactor.ai?
Validate your trading strategies with statistical credibility testing. Start free.
Get Started Free