Part of: Fundamental Analysis
Rule of 40: The Shorthand That Captures SaaS Health
The Rule of 40 collapses growth and profitability into a single number that should exceed 40 for a durable SaaS business.
 Sarah Patel8 min read
In Q3 2023 I was comparing two mid-cap SaaS names for a core position slot. Both had Rule of 40 scores of 45. On the headline number, they looked equivalent, clear the bar, durable business, defensible. I pulled the decomposition on both. Company A was growing revenue at 38% YoY with an FCF margin of 7%. Company B was growing at 14% with an FCF margin of 31%. Same R40, very different businesses. Company A was an expansion-stage SaaS still in land-and-expand mode; Company B was a mature SaaS leaning on price and retention for profitability. The strategic questions were different for each: for A, was the 38% growth sustainable long enough to eventually lift margin? For B, was the 14% growth enough to not be disrupted by a lower-priced competitor? I picked A on the view that the growth-to-margin path was cleaner than the margin-defense path. Over the following 14 months A delivered R40 of 47, 49, and 51 in successive quarters, while B drifted to 42 and 38 as growth slowed faster than margin expanded. Both businesses were durable; A had a more constructive glide path. The headline R40 told me neither was broken; the decomposition told me which one had the better trajectory. That's the real use of the card, the number is a screen; the breakdown is the analysis.
This post is about the Rule of 40 card, why the R40 framework actually works as a shorthand for operational health, and the three nuances that separate useful reads from box-checking.
TL;DR
- R40 = YoY revenue growth + TTM FCF margin should exceed 40 for a durable SaaS business.
- Rule of 40 only applies to recurring-revenue businesses: don't apply to banks, commodity producers, or project-based consultancies.
- Direction matters more than level. Rising R40 over 8 quarters beats stable R40.
- Decomposition reveals strategy. Growth-heavy R40 and margin-heavy R40 are different businesses.
- Use as a screen, not a conclusion. The check is necessary, not sufficient.
Why the Rule of 40 captures something real
SaaS companies face a fundamental operating trade-off: growth requires spend. More salespeople, more marketing, more R&D means higher growth but lower near-term operating margin. Conversely, cutting sales and marketing can juice margin but at the cost of growth. The Rule of 40 says the *sum* of the two should clear 40%:
- A 50% grower with -10% FCF margin (sum = 40) clears the bar
- A 10% grower with 30% FCF margin (sum = 40) also clears the bar
- A 25% grower with 15% FCF margin (sum = 40) is in the middle and also clears
The insight behind the shorthand: operational efficiency, the ability to either grow fast *or* convert to cash *or* both, is what separates good SaaS businesses from bad. A 20% grower with 5% margin (sum = 25) is struggling: growing slowly *and* not converting to cash is a sign of either competitive disadvantage or operational sloppiness. The 40 threshold is empirical, calibrated against the universe of public SaaS businesses, and has held up reasonably well across cycles.
What R40 doesn't say:
- It doesn't say the company is *cheap*, R40 is about operations, not valuation
- It doesn't say the company is *durable*, moat is a separate question
- It doesn't say the company is *growing in the right markets*, TAM is separate
- It doesn't say the business model is *sustainable*, the 40 could be transient
R40 is a health check, not a verdict. A company that clears 40 is operating efficiently. Whether the multiple you're paying for that efficiency is reasonable is a separate question.
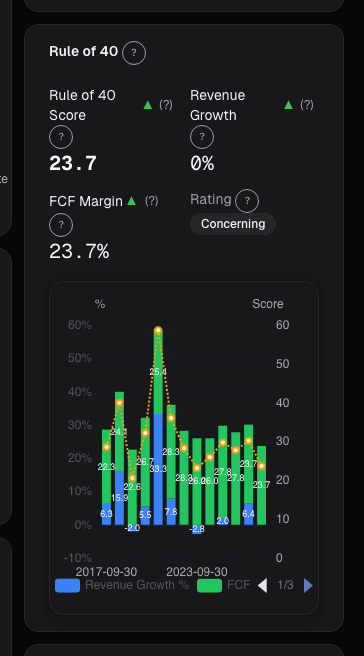
What the Rule of 40 card shows
The Rule of 40 card plots the issuer's R40 score over the trailing 20 quarters, with:
- Headline R40: current TTM revenue growth + TTM FCF margin
- 40-line reference: quarters above shaded green, below shaded red
- Component split: decomposition into growth vs. margin per quarter
- Peer-group comparison: R40 against sector median and top-quartile
- Quality-of-sum indicator: flag showing whether the 40 is coming mostly from growth (early-stage), margin (mature), or balanced
- Trajectory flag: rising, stable, or falling R40 over the last 8 quarters
Additional views:
- Historical achievement rate: % of trailing quarters above 40
- Decomposition over time: how the growth/margin split has evolved
- Scenario analysis: what R40 would be under modeled revenue and margin changes
Three nuances that matter
R40 only applies to recurring-revenue businesses. Applying the framework to commodity producers, banks, or project-based consulting is meaningless. The trade-off between growth and margin is specifically a recurring-revenue dynamic: expansion costs are front-loaded because customer lifetime value is long. For non-recurring businesses, the trade-off works differently and the 40 threshold has no empirical basis. The card restricts R40 computation to subscription and recurring-revenue classifications; applying it to anything else is user error.
Direction beats level. A company moving R40 from 30 to 45 over 8 quarters is a stronger setup than a company sitting at a stable 50 for 8 quarters. Rising R40 means operational leverage is kicking in or growth is accelerating; either is structurally positive. Falling R40 from 55 to 42 is a warning even though the 42 still clears the bar. The 4-quarter and 8-quarter trajectories are the diagnostic views; the headline is just today's snapshot.
Decomposition warns of pivots. When margin rises sharply while growth collapses, the business is mechanically "solving" R40 by cost-cutting rather than expanding. That's often a sign the business is approaching a terminal multiple, not an expanding one, margin expansion via cost cuts has a ceiling, but growth has compounded economics. The cleanest R40 profile is either: growth ≥ 2× margin for early-stage (meaning the business is growing fast and margin is the variable to improve), or margin ≥ growth for mature (meaning the business is cash-converting well and growth is steady). Sharp mid-cycle swings between the two are often signs of strategic change under pressure.
Example: the Q3 2023 comparison
The R40 decomposition I ran on the two candidates:
| Metric | Company A (expansion) | Company B (mature) |
|---|---|---|
| YoY revenue growth | 38% | 14% |
| TTM FCF margin | 7% | 31% |
| Rule of 40 | 45 | 45 |
| R40 8-quarter trajectory | 38 → 41 → 43 → 44 → 45 (rising) | 52 → 50 → 48 → 46 → 45 (falling) |
| Net revenue retention | 128% | 109% |
| Sales efficiency (magic number) | 1.1 | 0.6 |
| Gross margin | 77% | 82% |
Both at R40 = 45 on the headline, but the trajectories were moving in opposite directions. A was building to 45 from 38; B was sliding from 52 to 45. A had NRR of 128% (strong land-and-expand), B had NRR of 109% (retention-driven but modest expansion). A's sales efficiency was 1.1 (efficient growth); B's was 0.6 (more expensive growth). I chose A. Over the following 14 months:
| Quarter | A's R40 | B's R40 |
|---|---|---|
| Q4 2023 | 47 | 42 |
| Q1 2024 | 49 | 40 |
| Q2 2024 | 51 | 38 |
| Q3 2024 | 51 | 37 |
A extended the uptrend; B broke below 40. The underlying story was that B's growth continued to decelerate faster than margin could expand, while A's growth held and margin started improving. The stock performance followed: A was up ~34% over the 14 months, B was up ~3%. The R40 headline didn't differentiate the two at the start; the decomposition did.
What the Rule of 40 can miss
- Valuation. R40 is about operations; multiple is about valuation. A 60-R40 business at 40x sales can be a worse investment than a 30-R40 business at 4x sales.
- Quality of growth. Growth driven by churn-cohort stacking (NRR > 120%) is different from growth driven by new logos; the headline growth rate doesn't distinguish.
- Non-cash compensation. Stock-based comp can make reported FCF margin look much better than economic margin; R40 computed on GAAP SBC-adjusted margin tells a different story than TTM FCF R40.
- One-time items. Asset sales, lawsuit settlements, or tax benefits can inflate TTM FCF margin; normalize before computing.
- Seasonality. Some SaaS businesses have heavily seasonal billing; TTM smooths this but quarterly point-estimates can mislead.
Common mistakes
- Applying to non-SaaS businesses. The 40 threshold is empirical to recurring-revenue; it doesn't transfer.
- Reading headline without trajectory. Rising 35 and stable 45 are very different.
- Ignoring quality of the sum. R40 via cost-cutting is a very different setup than R40 via growth.
- Using GAAP margin without SBC adjustment. Stock-based comp can inflate reported margins significantly.
- Treating R40 as a buy signal. It's a screen, a necessary filter, not a sufficient verdict.
Where it fits
Use Rule of 40 alongside the DCF card and Reverse DCF, R40 tells you operational health; the DCFs tell you what you're paying for that health. For cross-sector sanity, use Peer Comparison, R40 is most useful within a peer group where the underlying business model is comparable. Pair with Sensitivity Analysis to see how R40 moves under growth-and-margin scenarios.
FAQ
What's the best-in-class R40?
Top-quartile SaaS businesses typically run R40 of 55-70; best-in-class exceed 70. Sub-30 is underperforming peers meaningfully.
Should I use FCF margin or operating margin?
FCF captures the cash-conversion reality better; operating margin can be inflated by aggressive revenue recognition or capitalization. FCF is the default.
How do I handle SBC?
SBC-adjusted FCF margin gives a more economically honest picture. The card provides both GAAP-reported and SBC-adjusted views; mature SaaS discussions should use adjusted.
Is 40 the right threshold in 2026?
It's been reasonably stable. Some argue the threshold should be higher in a higher-rate environment (45 or 50) to compensate for discount-rate pressure on long-duration growth. Reasonable, but the convention remains 40.
Does the card compute for private comparables?
No, R40 is computed on the target company's reported financials. Private comparable R40s require separate research.
Related reading
- EV/Revenue and Sales Multiple
- FCF Yield, Cash on Price
- Fundamentals EPV, Earnings Power
- Fundamentals Sensitivity Analysis
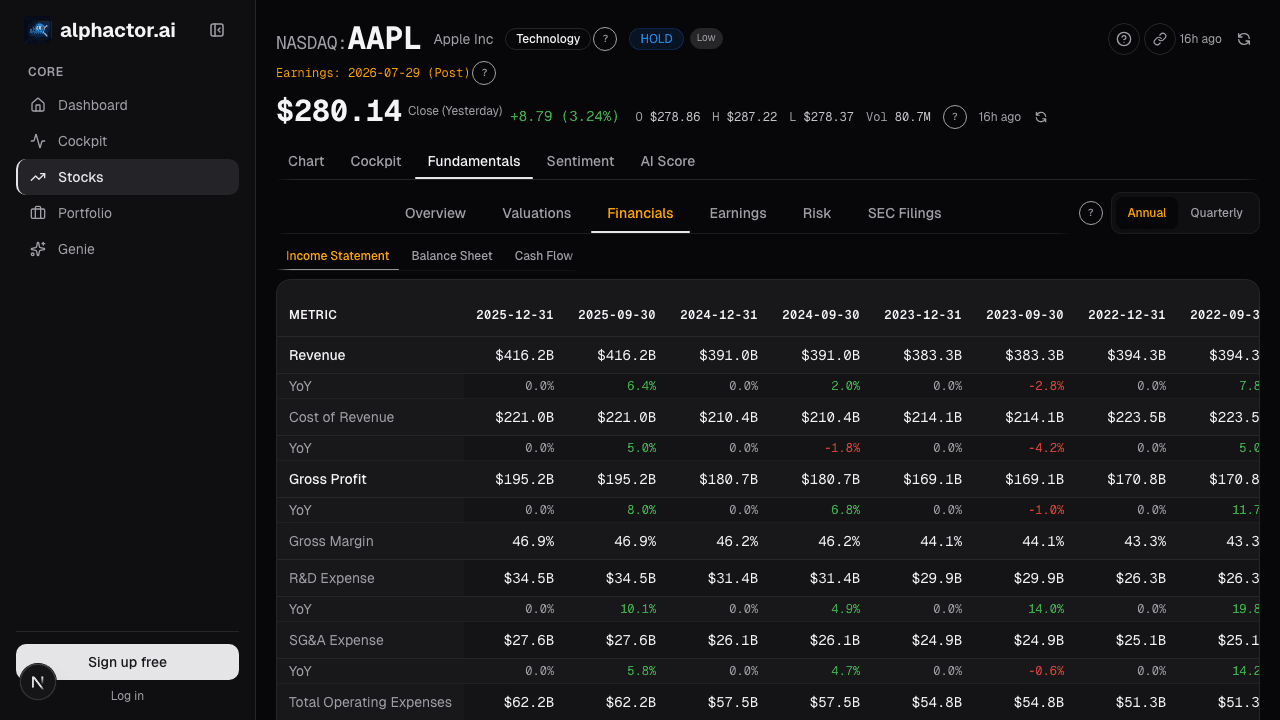
Open the Rule of 40 card → /app/stocks/AAPL/fundamentals
See it in the app
Live dashboard views that match this post. Each tile deep-links to the exact card.

Stocks mentioned
Related reading
Price-to-Book Value: Useful for Banks, Misleading for Tech
Price-to-book works for banks and asset-heavy industrials but misleads for software. Here is how to apply it correctly by sector and when to skip it.
EV/Revenue: The Multiple That Survives When Earnings Don't
EV/Revenue survives where P/E breaks, but needs a growth bridge. Pre-profit software mid-cycle runs 0.2-0.4x growth-adjusted, how to avoid the reading traps.
FCF Yield: What You're Actually Earning Today
FCF yield answers the most basic question in equity investing: if I buy this company today, how much cash does it throw off per dollar?
Earnings Power Value
EPV asks what a company is worth assuming zero growth, forever. The gap between EPV and market cap is the growth premium.
Valuation Sensitivity
A DCF prints one number; the truth is a distribution. Swinging WACC by 100 bps and terminal growth by 50 bps routinely moves the output by 40-70%.
Ready to try alphactor.ai?
Validate your trading strategies with statistical credibility testing. Start free.
Get Started Free