Part of: Fundamental Analysis
FCF Yield: What You're Actually Earning Today
FCF yield answers the most basic question in equity investing: if I buy this company today, how much cash does it throw off per dollar?
 Sarah Patel7 min read
In 2023 a colleague asked me whether a particular mature industrial "looked cheap" at 13× forward earnings. The stock had sold off about 18% from its 52-week high, the P/E multiple had compressed, and the sell-side narrative was that "the market was overreacting to near-term cyclical softness." My answer wasn't "cheap" or "expensive", it was "what's the FCF yield, and compared to what?" The trailing FCF yield was 7.1% on equity, 6.3% unlevered. The 10-year Treasury was at 4.3%. Investment-grade corporate yield at the same credit rating was 5.8%. On that relative-value basis, the FCF yield offered about 280 bps over Treasuries and 130 bps over equivalent-credit corporates, a meaningful premium, but one that had to compensate for operational risk the Treasury and corporate debt don't have. Whether it was "cheap enough" depended on the durability of that 7.1% yield: if it would hold at 7% for five years, the position was attractive; if it would compress to 4% because maintenance capex had been deferred, it was overpriced. That's the actual question FCF yield forces you to ask. The P/E multiple by itself can't force that question because it has no common unit of comparison. The yield does, it's directly comparable to every other yielding asset on your sheet.
This post is about the FCF Yield card, why yield-based valuation is cleaner than multiple-based, and the two interpretation rules that separate sustainable yield from lifted-by-capex-deferral yield that evaporates the next year.
TL;DR
- FCF yield is the reciprocal of the "FCF multiple" and is directly comparable to other yields (Treasuries, corporates, dividends).
- Normalize for capex cycle. A high yield that's lifted by deferred maintenance capex isn't repeatable.
- Compare equity yield vs. unlevered yield. Large gap means the equity yield is leveraged, great if debt is cheap, risky at refinancing.
- FCF yield only works for mature, cash-generative businesses. Growth names need different lenses.
- Historical yield percentile tells you whether this yield is rich or poor for this specific name.
Why yield beats multiple
Valuation multiples (P/E, EV/EBITDA, EV/Sales) are all reciprocals of yields, a 25× P/E is a 4% earnings yield, a 20× EV/EBITDA is a 5% EBITDA yield, etc. The inversion isn't just cosmetic. Yields let you compare directly against opportunity cost: the 10-year Treasury yield, an investment-grade corporate yield curve, a high-yield corporate yield curve, and dividend yields on peer equities.
A 25× P/E sounds abstract, is it high, low, reasonable? You have to know the growth rate, the quality, the context. A 4% earnings yield, by contrast, can be compared in one step to a 4.5% 10-year Treasury. The comparison tells you that the equity is yielding less than cash, which means the investor is paying a yield premium for something, typically growth. Is the growth worth the yield compression? That's a tractable question. "Is 25× rich?" is not a tractable question without a lot of additional context.
FCF yield is the highest-quality version of this idea because free cash flow is post-working-capital and post-capex, it's the cash an owner can actually take out. Earnings yield overstates cash because it includes non-cash items (accrual adjustments, deferred revenue, working-capital-driven net income). EBITDA yield understates cost because it ignores capital intensity. FCF yield is the most-cash-accurate version, which is why it's the right valuation lens for mature, cash-generative businesses where the operator could plausibly distribute the FCF without impairing operations.
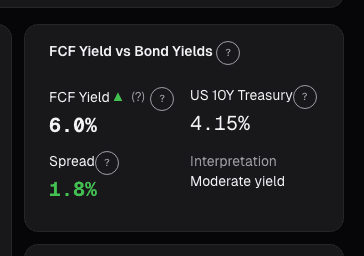
What the FCF Yield card shows
The FCF Yield card computes trailing FCF divided by enterprise value (unlevered yield) and trailing FCF divided by market cap (equity yield):
- Both yields plotted over 20 quarters alongside the issuer's 5-year mean and ±1σ bands
- Benchmark overlay showing risk-free rate (10-year Treasury) and an investment-grade corporate yield curve
- Decomposition view separating maintenance capex from growth capex, so reported FCF can be checked for sustainability
- Forward FCF yield based on consensus FCF estimates (where available)
- Historical percentile rank: is the current yield rich or poor vs. this name's own history?
- Sector comparison showing this name's yield vs. sector median
Two interpretation rules
Normalize for capex cycle. A mature business reporting a 7% FCF yield can't easily repeat it if the yield was lifted by skipping replacement capex. Deferred maintenance capex flatters FCF today at the cost of flattering it less next year (when the deferred maintenance catches up). The decomposition view separates maintenance capex from growth capex; if maintenance capex has dropped materially YoY without an operational reason, the FCF number is temporarily inflated. Always check the maintenance-capex trend before extrapolating the current yield forward.
Compare equity yield vs. unlevered yield. The gap between them is the leverage effect. A small gap means the company has little debt; the two yields track together. A large gap means the company is using debt to boost equity yield, great if debt is cheap and refinancing is easy, risky if rates are rising and a refinancing is approaching. The unlevered yield is the more durable number because it doesn't depend on the capital structure; the equity yield is higher today but can compress rapidly if debt costs rise.
The best quality signal is a high FCF yield *and* a clean decomposition (maintenance capex not being deferred, working capital not unwinding, unlevered yield not dramatically lower than equity yield). That combination is the setup where "cheap on FCF yield" is likely to persist and compound rather than being a one-year artifact.
Example: the 2023 mature industrial
The FCF yield context for the name I referenced in the intro:
| Metric | Current | 5-year mean | 5-year ±1σ |
|---|---|---|---|
| Equity FCF yield | 7.1% | 5.9% | 4.8% - 7.0% |
| Unlevered FCF yield | 6.3% | 5.5% | 4.6% - 6.4% |
| Maintenance capex / Revenue | 3.1% | 3.3% | 2.9% - 3.7% |
| 10-year Treasury | 4.3% | 2.4% | , |
| IG corporate yield (equivalent rating) | 5.8% | 3.6% | , |
Current equity yield of 7.1% is at the upper end of the 5-year range. Unlevered yield of 6.3% is also near the top of range. Maintenance capex is 3.1% of revenue vs. 3.3% mean, slightly below but within the normal band, not enough to suggest deferred maintenance is distorting the yield. The yield premium over Treasuries (280 bps) and IG corporates (130 bps) is above the historical average. On a relative-value basis, the position was attractive; the durability check on maintenance capex confirmed the yield was repeatable. Position held for 18 months with the yield gradually compressing back toward the 5-year mean as the price recovered.
What FCF yield can miss
- Growth names. FCF is often negative or lumpy for pre-profit growth companies; FCF yield isn't the right lens. Use EV/Revenue or Rule of 40 instead.
- Cyclicals at trough or peak. A mid-cycle FCF yield can look attractive, but cyclical-trough FCF is unsustainable upward and peak FCF is unsustainable downward. Normalize over full cycle.
- Working-capital one-offs. A one-time WC unwind (inventory reduction, receivables collection) lifts FCF in the short term without being repeatable.
- Acquisition-heavy companies. M&A cash outflows mess with FCF; reported FCF and "underlying" FCF can diverge substantially.
- REITs and BDCs. Use FFO or NII-based yields instead; reported FCF isn't the operating metric for these structures.
Common mistakes
- Comparing FCF yield across sectors without sector-normalization. A 7% yield in software is unusual; the same yield in mature industrials is normal. Always compare within sector.
- Ignoring the capex decomposition. Maintenance vs. growth capex matters for sustainability; treating them as one lump misses the information.
- Using trailing-only yield. Forward yield is equally important for growing or declining businesses.
- Treating yield as a buy signal. A high yield can be a value trap if the business is structurally impaired. Pair with F-Score or Altman Z for quality filter.
- Over-levering the equity yield comparison. A company with 5× debt/EBITDA will always show a high equity FCF yield, that's not value, it's leverage.
Where it fits
FCF Yield is the valuation anchor for mature, cash-generative names; pair with Rule of 40 for growth names (where FCF yield is low or negative and not the right lens yet) and DCF for explicit forecasts. Cross-check with Cashflow for quality of the FCF itself, recurring cash earns a lower risk premium than lumpy cash. For the zero-growth anchor that complements the cash-flow-yield view, see EPV, Earnings Power Value.
FAQ
Equity yield or unlevered yield: which is primary?
Unlevered is primary for cross-company comparison (capital structure invariant). Equity is primary for the direct shareholder-return comparison.
How is maintenance capex determined?
The card uses management disclosures where available; otherwise, a 5-year-average capex minus the growth-attributable portion (estimated from revenue growth rate). Methodology is documented in the card tooltip.
How fresh is the yield calculation?
Yield refreshes with each 10-Q filing (quarterly). Forward yield uses consensus FCF estimates, refreshed monthly.
Does this work for financial companies?
Not directly, banks, insurers, and asset managers have different cash-flow dynamics. Use sector-specific yield measures (ROE, P/TBV for banks; P/E-on-normalized earnings for asset managers).
What's the "right" FCF yield threshold?
No universal answer. Relative to the 10-year Treasury plus 200-400 bps is a common threshold for mature businesses; adjust for sector and quality. The percentile-vs-own-history is often more useful than an absolute threshold.
Related reading
- EV/Revenue, Sales Multiple
- Fundamentals EPV, Earnings Power
- Fundamentals Sensitivity Analysis
- PEG, Growth-Adjusted Multiple
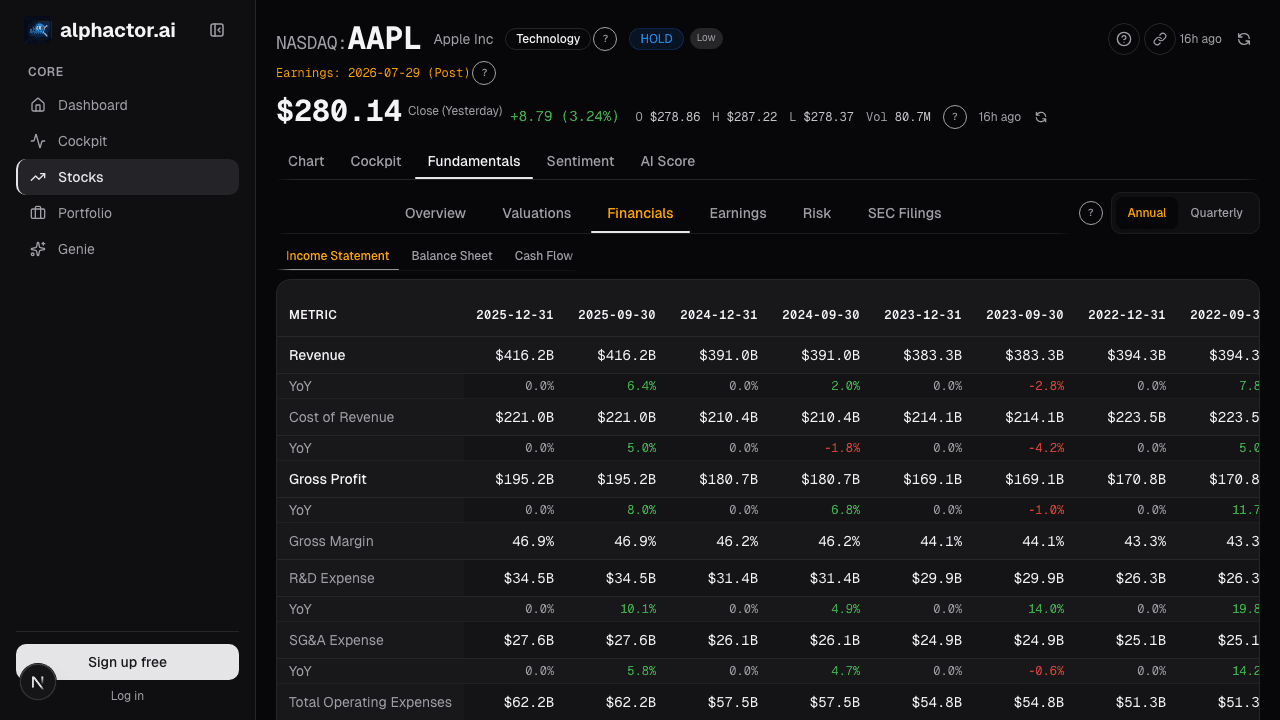
Open the FCF Yield card → /app/stocks/AAPL/fundamentals
See it in the app
Live dashboard views that match this post. Each tile deep-links to the exact card.

Stocks mentioned
Related reading
Price-to-Book Value: Useful for Banks, Misleading for Tech
Price-to-book works for banks and asset-heavy industrials but misleads for software. Here is how to apply it correctly by sector and when to skip it.
DCF vs Multiples: When to Use Each Valuation Method
When discounted cash flow analysis works, when relative multiples are better, and the pitfalls that trip up both approaches.
EV/EBITDA: What Professionals Use Instead of P/E
Why enterprise value to EBITDA is the preferred valuation metric on Wall Street, how to calculate it, and when it gives a clearer picture than P/E.
EV/Revenue: The Multiple That Survives When Earnings Don't
EV/Revenue survives where P/E breaks, but needs a growth bridge. Pre-profit software mid-cycle runs 0.2-0.4x growth-adjusted, how to avoid the reading traps.
Why Free Cash Flow Matters More Than Earnings
Earnings can be managed. Cash flow cannot. How to use free cash flow to evaluate business quality and avoid accounting illusions.
Earnings Power Value
EPV asks what a company is worth assuming zero growth, forever. The gap between EPV and market cap is the growth premium.
Ready to try alphactor.ai?
Validate your trading strategies with statistical credibility testing. Start free.
Get Started Free