Part of: Fundamental Analysis
DCF vs Multiples: When to Use Each Valuation Method
When discounted cash flow analysis works, when relative multiples are better, and the pitfalls that trip up both approaches.
 Sarah Patel4 min read
Two Philosophies of Value
Every stock valuation method boils down to one of two questions. A discounted cash flow (DCF) model asks: "What is the present value of all future cash this business will generate?" A multiples-based approach asks: "What are similar businesses selling for right now?"
Neither is inherently superior. They answer different questions and break in different ways. Knowing when to reach for each one is a more valuable skill than mastering either in isolation.
How DCF Works (and Where It Breaks)
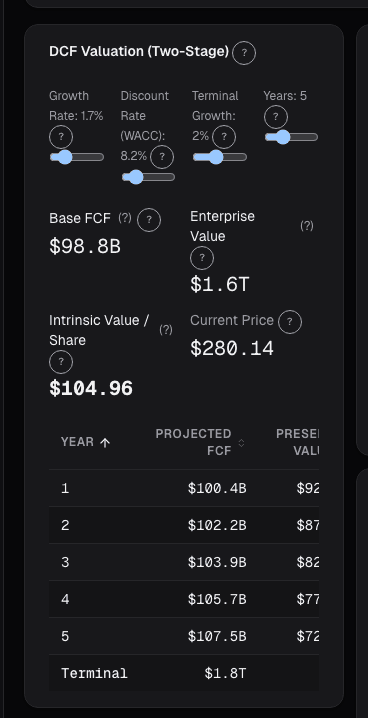
A DCF model projects a company's free cash flow over some forecast period, typically 5-10 years, then discounts those future cash flows back to today using a discount rate that reflects the risk of owning the business.
The appeal is obvious: DCF is grounded in the fundamental economic value of the business. It does not care what the market thinks. It does not care what competitors trade at. It is a first-principles calculation.
The problem is that DCF is exquisitely sensitive to its inputs. A company generating $500 million in annual free cash flow valued with 8% growth and a 10% discount rate comes out around $8.2 billion. Change growth to 12% and you get roughly $10.5 billion. Shift the discount rate from 10% to 9% and it jumps again. Small assumption changes produce large swings.
This makes DCF most useful for businesses with:
- Stable, predictable cash flows. Utilities, mature consumer staples, infrastructure companies. When cash flows are steady, your projection errors stay bounded.
- Long operating histories. You need data to anchor your growth assumptions. A 50-year-old industrial company gives you a much better base than a 3-year-old SaaS startup.
- Clear capital allocation patterns. If you can reasonably forecast reinvestment rates and returns on capital, the model holds together.
DCF is least useful for early-stage companies with negative cash flow, businesses undergoing major transitions, or cyclical companies where the current year tells you little about the next five.
How Multiples Work (and Where They Break)
Multiples-based valuation picks a metric, usually earnings, revenue, EBITDA, or book value, and compares the ratio of price to that metric across a peer group. If the sector median P/E is 18 and your stock trades at 14, the market is pricing it at a discount to peers.
The appeal is speed. You can screen 500 stocks in the time it takes to build one DCF model. Multiples also embed the market's current view of risk and growth implicitly, so you do not need to estimate a discount rate.
The problem is that multiples are inherently relative. If the entire sector is overvalued, a stock below the sector median can still be expensive in absolute terms. In late 1999, a tech stock at P/E 50 looked cheap versus peers at 100. Both were wildly overvalued.
Multiples also struggle with:
- Cross-sector comparisons. A P/E of 12 means something different for a bank than for a software company. Capital intensity, margins, and growth profiles all differ.
- Accounting differences. Two companies with similar economics can report different earnings depending on depreciation methods, stock-based compensation, or revenue recognition.
- One-time items. A big restructuring charge or asset sale can distort trailing multiples for a full year.
A Practical Decision Framework
Rather than picking one method and defending it, use the nature of the business to guide your approach:
Use DCF when the company has stable cash flows and a long history to calibrate against. REITs, regulated utilities, and mature dividend payers are classic DCF candidates.
Use multiples when you need a quick relative comparison, when the company is too early-stage for reliable cash flow projections, or when comparing acquisition targets within the same industry. Multiples also serve as a sanity check: if your DCF says $200 but every comparable trades at a multiple implying $120, investigate the gap.
Use both when the stakes are high. Professional analysts triangulate: DCF, comparable company analysis, and precedent transactions. If all three converge, conviction increases. If they diverge sharply, that divergence is informative.
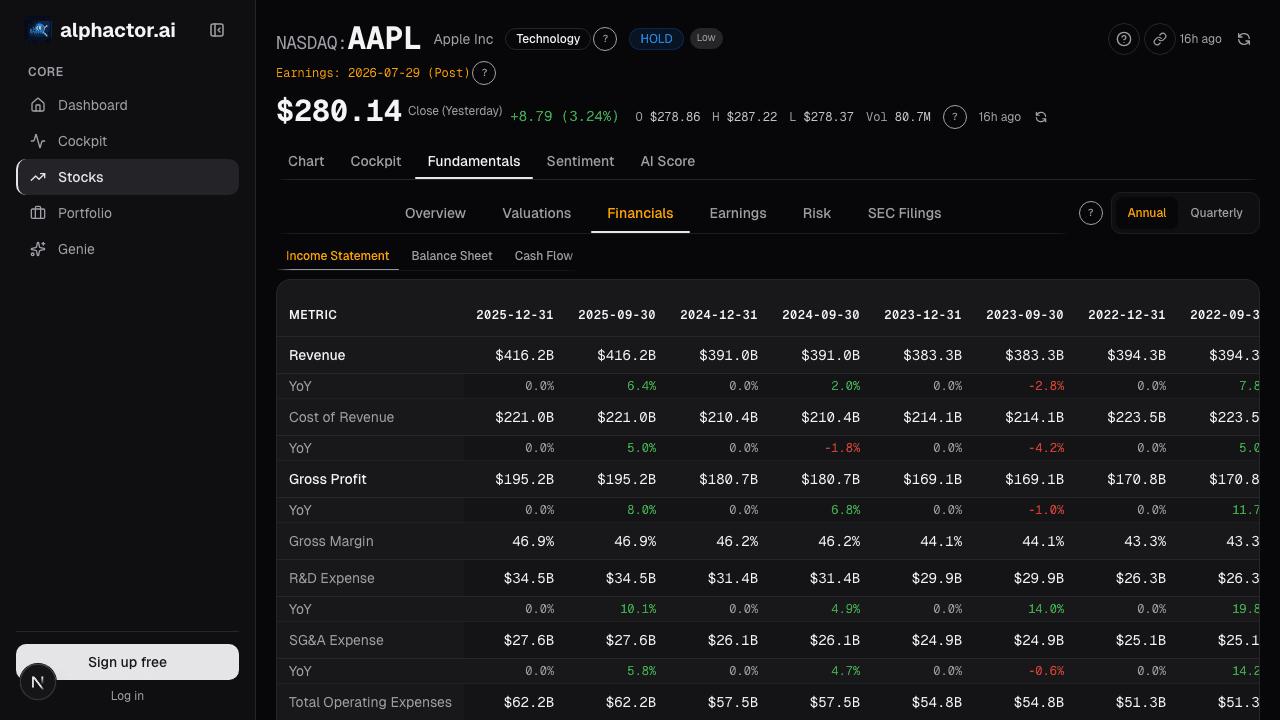
Alphactor's fundamentals view surfaces key multiples (P/E, EV/EBITDA, P/S, P/FCF) alongside sector medians and historical ranges. The stock comparison tool lets you line up multiples across a peer group in seconds. This gives you the relative picture quickly, so you can decide whether a deeper DCF analysis is worth the time.

The Biggest Pitfall: False Precision
Both methods tempt you toward false precision. A DCF model that spits out $147.32 per share is not more accurate than one that says "$130-170 range." A stock trading at 14.2x earnings versus a peer group at 15.1x is not meaningfully cheaper.
Think in ranges, not point estimates. If three reasonable sets of assumptions all put the stock below current price, you have a signal. If the answer swings dramatically with each assumption change, you are speculating on the assumptions, not investing in the business.
See it in the app
Live dashboard views that match this post. Each tile deep-links to the exact card.

Stocks mentioned
Related reading
Price-to-Book Value: Useful for Banks, Misleading for Tech
Price-to-book works for banks and asset-heavy industrials but misleads for software. Here is how to apply it correctly by sector and when to skip it.
EV/Revenue: The Multiple That Survives When Earnings Don't
EV/Revenue survives where P/E breaks, but needs a growth bridge. Pre-profit software mid-cycle runs 0.2-0.4x growth-adjusted, how to avoid the reading traps.
FCF Yield: What You're Actually Earning Today
FCF yield answers the most basic question in equity investing: if I buy this company today, how much cash does it throw off per dollar?
Earnings Power Value
EPV asks what a company is worth assuming zero growth, forever. The gap between EPV and market cap is the growth premium.
Reverse DCF: Solving for the Market's Implied Growth
Reverse DCF yields one testable implied growth rate you compare to realized history and peer comps to judge whether a stock price is stretched or reasonable.
Ready to try alphactor.ai?
Validate your trading strategies with statistical credibility testing. Start free.
Get Started Free