Part of: Fundamental Analysis
Reverse DCF: Solving for the Market's Implied Growth
Reverse DCF yields one testable implied growth rate you compare to realized history and peer comps to judge whether a stock price is stretched or reasonable.
 Sarah Patel8 min read
In late 2023 I was looking at a mature software compounder trading around 28x forward FCF. A conventional DCF I'd built said the stock was fairly valued assuming 11% FCF growth for ten years and a 9% WACC. A colleague running the same model had it undervalued assuming 13% growth; another had it overvalued assuming 9%. Three analysts, three "right" answers, each reflecting the assumptions they walked in with. I ran the reverse DCF instead, holding WACC and terminal growth fixed and solving for the FCF growth rate that equated the model's present value with the actual market cap. The number was 11.6%. That single figure was the market's already-priced expectation. I could then check it against what I actually knew about the business: 5-year realized FCF growth was 9.2%, peers at similar multiples were implied at 8-10%, and sell-side consensus was modeling 10.5% over the next three years tapering to mid-single-digits. The market was pricing about 100-150 bps above every reasonable comparison, with no obvious reason for the premium. That wasn't proof the stock was expensive, it was a statement of what I'd need to believe to be a buyer. When I couldn't construct a defensible reason the business would outrun its history and its peers by 100+ bps for a decade, I passed. The stock underperformed by 14 points over the next nine months. The reverse DCF didn't make the call; it made the call legible.
This post is about the Reverse DCF card, why the reverse framing is a cleaner tool than forward DCF for judgement-style investors, and the three comparisons that turn the implied-growth number into an actionable verdict.
TL;DR
- Forward DCF solves for price given growth; reverse DCF solves for growth given price. The second question is more answerable.
- Implied growth is a single testable number: compare to realized, peers, consensus.
- The sensitivity strip at ±1% WACC / ±1% terminal bounds the uncertainty.
- Implied growth above realized growth requires a defensible why: moat expansion, margin ramp, TAM expansion.
- Use with conventional DCF as triangulation, not as a replacement.
Why forward DCF has a problem
A forward DCF requires three judgement calls, revenue growth path, margin path, WACC, each of which has a plausible range of 200-400 bps. Small changes compound over a 10-year forecast window: moving revenue growth from 10% to 12% and margin from 25% to 27% can double the intrinsic value. Every analyst I've ever worked with has, at some point, produced a DCF that happened to agree with their prior. The inputs get nudged until the output feels right. The final number feels rigorous but is mostly a long-form way of expressing a gut call.
The reverse DCF inverts the problem:
- Market cap becomes a given, not an output
- Growth rate becomes the solved variable, not an input
- You're left with one number to evaluate, not three simultaneous judgement calls
- The remaining question, "is this growth rate achievable?", is answerable from business history, peer comps, and consensus
The reverse framing doesn't eliminate assumptions (WACC and terminal growth still matter); it concentrates them where they can be sanity-checked against bounded ranges.
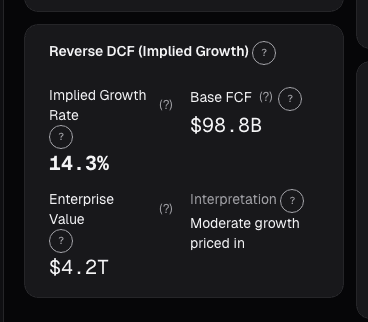
What the Reverse DCF card shows
The Reverse DCF card takes four inputs and solves for the fifth:
- Enterprise value: current market value from the price feed (adjusted for net cash/debt)
- WACC: default 9%, override for rate-sensitive names or very different capital structures
- Current FCF baseline: TTM free cash flow, with optional normalization toggles (strip one-time items, normalize working capital)
- Terminal growth: default 2.5%, capped at the long-run nominal GDP rate
- Explicit-forecast horizon: default 10 years, with 5 and 15 as alternates
It solves numerically for the FCF growth rate across the explicit window that equates the present value of forecasted FCF (plus terminal value) with today's EV.
Output views:
- Headline implied growth: single number, stated to one decimal place
- Sensitivity strip: implied growth at ±1% WACC and ±1% terminal growth, bounding the uncertainty
- Comparison band: implied growth plotted against issuer's realized 5-year growth, sell-side 3-year consensus, and peer-group median implied growth
- Cash-flow schedule: year-by-year FCF required to support today's price
- Assumption overrides: swap in your own WACC, normalize FCF to exclude a one-time event
The three comparisons that make the number actionable
Implied growth vs. realized 5-year growth. The cleanest check: can this company continue to grow at the rate the market is implying, based on its own track record? If implied is 11.6% and realized is 9.2%, the market is betting on a 240-bp acceleration. Acceleration is possible (new product cycles, operating leverage kicking in, TAM expansion), but it requires a specific reason. If you can't articulate the reason in one sentence, the bar is probably too high. If implied is below realized, the market is pricing deceleration, which is sometimes correct (law of large numbers, mature market) and sometimes an opportunity (temporary fear creating durable-growth mispricing).
Implied growth vs. peer-group implied growth. Run the same reverse DCF on the company's 3-5 closest peers. If your name is implied at 11.6% and peers cluster at 8-10%, you're paying a 150-300 bp premium to the comp set. That premium may be justified (better moat, better margin structure, bigger TAM) or unjustified. The question becomes concrete and bounded: why should this company grow 1.5-3 percentage points faster than its direct competitors for a decade? If the answer is "it's a better business," fine, but try to express the "better" in numbers. If you can't, the premium is probably sentiment, not fundamentals.
Implied growth vs. sell-side consensus. Pull the 3-year FCF growth consensus from the estimate feed. If implied is 11.6% and consensus is 10.5% over 3 years before tapering, the market is pricing above what the analysts, who have modeled the business more granularly than you have, are projecting. That's either the analysts being too conservative (common in late-cycle growth stories) or the market being overly optimistic. Either way, you now know where the disagreement lives: between the market's long-run view and the analysts' near-term view.
Example: the 28x software compounder
My reverse DCF snapshot from late 2023:
| Input / Output | Value |
|---|---|
| Enterprise value | $148B |
| TTM FCF (normalized) | $5.1B |
| WACC | 9.0% |
| Terminal growth | 2.5% |
| Forecast horizon | 10 years |
| Implied 10-year FCF growth | 11.6% |
| Sensitivity: WACC -1% (8%) | 9.8% implied |
| Sensitivity: WACC +1% (10%) | 13.5% implied |
| Sensitivity: Terminal +1% (3.5%) | 10.5% implied |
Comparisons:
| Reference | FCF Growth Rate | Delta to Implied |
|---|---|---|
| Issuer 5-year realized | 9.2% | -240 bps |
| Peer-group median implied | 9.1% | -250 bps |
| Sell-side 3-year consensus | 10.5% | -110 bps |
| Market-implied (this card) | 11.6% | , |
Every comparison pointed to the implied rate being a stretch. The issuer's own 5-year track was 240 bps below. The three closest peers were collectively 250 bps below. Sell-side was 110 bps below. No single comparison was damning, but the convergence was. I couldn't write down a one-sentence reason the business would grow 100-250 bps faster than every available reference point for a decade. I passed. The stock drifted down over the subsequent nine months as consensus FCF estimates were trimmed. The reverse DCF didn't forecast the move; it made the bet I would have been taking visible in a single testable number.
What the reverse DCF can miss
- Optionality in early-stage businesses. Platform companies with legitimate TAM expansion may justify implied growth far above realized history. Discount rate alone won't capture this.
- Margin path. The card solves for FCF growth, not revenue growth plus margin expansion separately. Businesses with margin tailwinds look different than pure top-line growers.
- Capital intensity shifts. If capex-to-sales is changing structurally, the TTM FCF baseline may mislead.
- Reinvestment rate assumptions. Implicit in terminal value; for high-ROIC businesses that can keep reinvesting, the default terminal may be too conservative.
- Cyclicality. For cyclical names, using TTM FCF as baseline can dramatically over- or under-state. Normalize to mid-cycle FCF before running.
Common mistakes
- Treating implied growth as truth. It's the market's statement, not reality. The value is in comparing it to reality.
- Ignoring the sensitivity strip. A 200 bp swing in WACC changes implied growth by 2-4 points; know where your call lives in that range.
- Comparing implied growth to TTM revenue growth. FCF growth and revenue growth diverge with margin change; use FCF realized for the comparison.
- Running reverse DCF without normalizing. One-time working capital moves can swing the baseline 20-30%; always normalize first.
- Using default WACC on everything. Leveraged businesses, rate-sensitive REITs, and biotechs need different discount rates. The default is a starting point.
Where it fits
Reverse DCF pairs tightly with the conventional DCF card for triangulation, the two models use the same machinery but answer opposite questions. Cross-check with the Peer Comparison card for the peer-implied-growth comparison, and with Earnings History for the realized-growth check. For cyclical names, combine with Sensitivity Analysis to see how implied growth moves across margin and revenue scenarios.
FAQ
What WACC should I use?
The default 9% is a reasonable starting point for US large-cap equity. For REITs, leveraged businesses, or very rate-sensitive names, override. The sensitivity strip shows how the answer moves at ±1%.
Why 10 years for the explicit window?
Balances long-enough-to-matter with short-enough-to-be-credible. 5-year is reasonable for faster-moving businesses; 15-year for very stable compounders.
What's a "normal" implied growth rate?
Highly context-dependent. Mature staples: 2-5%. Mature tech compounders: 6-10%. High-growth software: 15-25%. Compare to realized, not to some universal benchmark.
Does terminal growth really matter?
Yes, roughly 40-60% of present value sits in the terminal term. The default 2.5% is near long-run nominal GDP; going higher requires justification.
Can I use this for unprofitable businesses?
Not directly. Reverse DCF needs a positive FCF baseline. For pre-profitability businesses, use EV/Revenue-based approaches or normalize to a steady-state margin scenario.
Related reading
- DCF vs. Multiples
- EV/Revenue and Sales Multiple
- FCF Yield, Cash on Price
- Fundamentals EPV, Earnings Power
Open the Reverse DCF card → /app/stocks/AAPL/fundamentals
See it in the app
Live dashboard views that match this post. Each tile deep-links to the exact card.

Stocks mentioned
Related reading
Price-to-Book Value: Useful for Banks, Misleading for Tech
Price-to-book works for banks and asset-heavy industrials but misleads for software. Here is how to apply it correctly by sector and when to skip it.
DCF vs Multiples: When to Use Each Valuation Method
When discounted cash flow analysis works, when relative multiples are better, and the pitfalls that trip up both approaches.
EV/Revenue: The Multiple That Survives When Earnings Don't
EV/Revenue survives where P/E breaks, but needs a growth bridge. Pre-profit software mid-cycle runs 0.2-0.4x growth-adjusted, how to avoid the reading traps.
FCF Yield: What You're Actually Earning Today
FCF yield answers the most basic question in equity investing: if I buy this company today, how much cash does it throw off per dollar?
Earnings Power Value
EPV asks what a company is worth assuming zero growth, forever. The gap between EPV and market cap is the growth premium.
Ready to try alphactor.ai?
Validate your trading strategies with statistical credibility testing. Start free.
Get Started Free