Part of: Fundamental Analysis
PEG Ratio: A Growth-Adjusted P/E, Less Naive Than It Looks
Naive PEG ignores growth quality and buyback distortions. The fix: use 3-5 year organic EPS CAGR and compare only within a profit-consistent peer group.
 Sarah Patel7 min read
I spent three months in 2016 ignoring a screen that was flagging what looked like an obvious PEG bargain, forward P/E 14, 3-year EPS growth 22%, PEG 0.64. The headline was textbook Peter Lynch: growth at a reasonable price. The reason I ignored it was that when I pulled the growth apart, roughly 70% of the 22% EPS growth was buyback-driven, the company had reduced share count 5% a year via debt-financed buybacks while underlying revenue was growing 3%. Earnings-per-share was real, but the earnings themselves weren't compounding, share count was just shrinking. Naive PEG priced it as a grower. The actual economic growth was mid-single-digits. I passed. The stock underperformed peers over the next three years as the buyback well ran dry and the underlying revenue ceiling became visible. The PEG wasn't wrong, I was reading it wrong.
This post is about the PEG card, why naive PEG is dismissed, and the three fixes that turn it back into a usable cross-sectional screen.
TL;DR
- Naive PEG is rightly criticized for ignoring balance sheet, margin, and growth quality. The fixes are straightforward.
- Use long-term EPS growth, not next-year. Next-year is noise; 3–5-year CAGR is trend.
- Decompose growth into organic vs share-count-driven. Buyback-inflated EPS isn't the same thing as compounding.
- Compare inside a profit-consistent peer group. PEG across profitability tiers is apples to oranges.
- PEG < 1 is the Lynch threshold, but only meaningful with organic-growth share > 70%. Otherwise the "discount" is mechanical.
The objection to naive PEG and the fix
The standard critique of PEG (P/E divided by EPS growth rate) is that it ignores balance sheet quality, capital intensity, and margin durability; that the EPS-growth input is easily manipulated by buybacks; and that it behaves badly when growth is near zero. All of that is true for naive PEG. But the tool stays useful once three conditions are met: (a) use *long-term* EPS growth rather than next-year estimates, (b) decompose the growth into organic (revenue × margin) vs share-count-driven, and (c) apply PEG only inside a profit-consistent peer group.
Naive PEG is rightly dismissed in academic and buy-side research because the naive version is genuinely uninformative at scale. Growth-quality-adjusted PEG, applied carefully, is something else, it's a screen that combines valuation and growth trajectory in a way that raw P/E alone cannot. Raw P/E says a stock is cheap. PEG says a stock is cheap *relative to how fast it's growing*. That qualification matters when growth rates dispersed widely across companies that superficially trade at similar multiples.
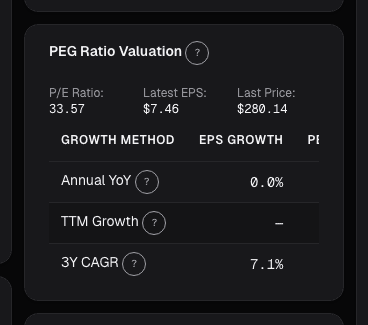
What the PEG card shows
The PEG card plots four variants side by side:
- Forward P/E ÷ sell-side 3-year EPS CAGR: the classic Lynch version
- Forward P/E ÷ internal 5-year EPS CAGR: our model, longer window, less susceptible to near-term forecast noise
- Growth-quality-adjusted PEG: EPS growth decomposed into revenue-growth, margin-expansion, and share-count-reduction contributions; only the first two count toward the "real" growth used in the denominator
- Peer-group median PEG: the sector-or-profile-matched benchmark for comparison
The headline color-codes at Lynch thresholds, green below 1.0, yellow 1.0–2.0, red above 2.0. Those thresholds remain useful, but the interpretation is now tier-aware: PEG < 1 on a buyback-heavy name isn't the same as PEG < 1 on an organic grower, and the card shows you which you're looking at.
Reading the signal
PEG < 1 with organic-growth share > 70%. This is a real bargain on a real grower. Most "bargain" PEGs in screens are driven by buyback-inflated EPS, a company can grow EPS 8% with 2% revenue growth by shrinking share count 6% a year via debt-funded buybacks. That EPS growth is real for a holder but it isn't compounding organic earnings power. The growth-quality-adjusted PEG separates the two; the organic share is what counts toward durable growth.
PEG > 2 with decelerating growth. Growth shrinking toward the denominator means the ratio will worsen as growth continues to slow. A PEG of 2.5 that's been rising from 1.2 over three quarters as growth has decelerated from 30% to 15% is on a trajectory toward 3–4 in the next year. That's usually the point where the multiple compresses or the fundamentals have to re-accelerate. Either way, the current price isn't a buying opportunity.
PEG converging to peer median from below. A name that was at PEG 0.6 while peers sat at 1.1 is now at 0.9 while peers still sit at 1.1. The discount is closing, fine for an existing holder, poor entry for a new buyer. The relative opportunity that existed at the 0.6 level has been partially priced in.
Example: three names at the same PEG
Three mid-cap consumer names I was comparing in Q4 2024:
| Metric | Company A | Company B | Company C |
|---|---|---|---|
| Forward P/E | 16 | 18 | 17 |
| 3-year EPS CAGR | 18% | 20% | 19% |
| Naive PEG | 0.89 | 0.90 | 0.89 |
| Revenue CAGR | 16% | 4% | 11% |
| Margin expansion contribution | +2pp | +5pp | +3pp |
| Share-count reduction | -1% | -11% | -5% |
| Organic-growth share | ~90% | ~30% | ~65% |
| Growth-quality PEG | 0.89 | 2.96 | 1.37 |
On naive PEG all three looked equivalently cheap. On the quality-adjusted view Company A is the real grower (revenue compounding, margins expanding modestly, minimal buyback contribution); Company B's "growth" is almost entirely buyback arithmetic; Company C is in between. Twelve months later Company A was up 28%, Company B was flat, Company C was up 9%. The PEG discipline, read with the quality decomposition, was doing its job.
What PEG can't fix
- Zero-growth names. PEG mathematically breaks as growth approaches zero (denominator → 0 makes the ratio explode). Don't read PEG on mature flat-EPS businesses; use P/E and FCF yield instead.
- Cyclicals at peak or trough. Peak-cycle EPS with next-year growth estimates that assume continuation produce misleadingly low PEG; trough-cycle with deep-recession earnings produce misleadingly high PEG. PEG works best on trend-grown businesses, not peaky ones.
- Pre-profit names. No EPS, no PEG. Use EV/Revenue with a growth bridge instead.
- Conglomerates with mixed growth profiles. A diversified industrial with one fast-growing segment and one slow-declining segment has a blended EPS growth rate that masks the composition. Segment-level analysis is needed.
Common mistakes
- Using next-year EPS growth as the denominator. Noisy; manipulable; often flatters. 3-year or 5-year CAGR is more stable.
- Ignoring the buyback contribution. Buyback-driven EPS growth is real for a holder but shouldn't be extrapolated as if it were organic compounding.
- Comparing PEG across profitability tiers. A pre-profit-going-profitable name with 200% EPS growth has an undefined / tiny PEG that isn't comparable to a mature grower.
- Treating PEG 0.7 as "always cheap." Sometimes it's cheap because the market is pricing a growth slowdown that hasn't shown up in estimates yet. The market is often earlier than estimates.
- Using PEG as a standalone screen. Combine with FCF yield, balance sheet, and at least one quality metric.
Where it fits
Use PEG alongside EV/Revenue for pre-profit names where PEG doesn't compute, Rule of 40 for SaaS-style operational quality, and Reverse DCF to cross-check that the growth the market is implying lines up with the growth you're paying for via PEG. For quality confirmation, Piotroski F-Score is a complement.
FAQ
Did Peter Lynch use growth-quality-adjusted PEG?
No, he used naive PEG, but he also applied it with strong qualitative screens (understanding the business, avoiding fad-driven stocks, checking balance sheet). The quality adjustment formalizes what he did by judgment.
What's the right growth window: 3-year or 5-year?
5-year is more stable and less susceptible to forecast noise. 3-year is more responsive to recent trajectory. The card shows both; I weight toward 5-year for mature businesses and 3-year for growth names still establishing trend.
How do I handle buybacks in a company with natural share-count discipline?
If buybacks are steady and fully earnings-funded (no debt increase), they're closer to a dividend than to financial engineering. The growth-quality card still flags them as share-count-driven, but the interpretation is different, it's a return of capital, not a one-time EPS lift.
Can I PEG-screen using the card?
Yes, the Screener supports PEG bands with growth-quality filters. The screen of (PEG < 1, organic-growth share > 60%, Rule of 40 > 30) is a reasonable starting point for quality GARP ideas.
What's a good PEG threshold?
Lynch's under-1 heuristic is still reasonable as a starting point, adjusted for the growth-quality caveat. In practice, high-quality names rarely trade at PEG < 1 for long, most sustained bargain PEGs I find are around 0.8–1.0 with good quality, not sub-0.5 with problems.
Related reading
- Price-to-Sales and Growth
- EV/Revenue and EV/Sales Multiples
- FCF Yield, Cash on Price
- EPV, Earnings Power Value
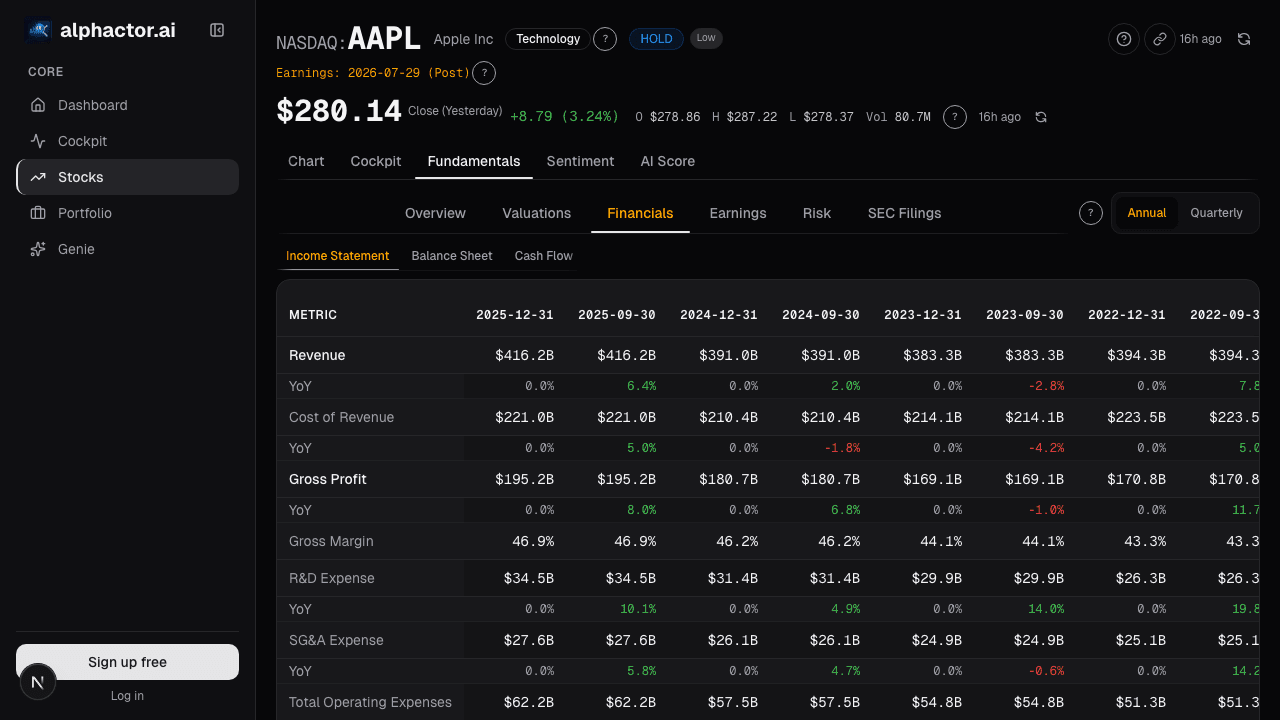
Open the PEG card → /app/stocks/AAPL/fundamentals
See it in the app
Live dashboard views that match this post. Each tile deep-links to the exact card.

Stocks mentioned
Related reading
EV/Revenue: The Multiple That Survives When Earnings Don't
EV/Revenue survives where P/E breaks, but needs a growth bridge. Pre-profit software mid-cycle runs 0.2-0.4x growth-adjusted, how to avoid the reading traps.
FCF Yield: What You're Actually Earning Today
FCF yield answers the most basic question in equity investing: if I buy this company today, how much cash does it throw off per dollar?
Earnings Power Value
EPV asks what a company is worth assuming zero growth, forever. The gap between EPV and market cap is the growth premium.
Valuation Sensitivity
A DCF prints one number; the truth is a distribution. Swinging WACC by 100 bps and terminal growth by 50 bps routinely moves the output by 40-70%.
Price-to-Sales for Growth Stocks
How to use price-to-sales ratio to value high-growth companies that are not yet profitable, and the traps that make this metric dangerous.
Not All Revenue Growth Is Created Equal
Why the source and sustainability of revenue growth matters more than the headline number, and how to distinguish organic growth from accounting illusions.
Ready to try alphactor.ai?
Validate your trading strategies with statistical credibility testing. Start free.
Get Started Free