Part of: Fundamental Analysis
Price-to-Sales for Growth Stocks
How to use price-to-sales ratio to value high-growth companies that are not yet profitable, and the traps that make this metric dangerous.
 Sarah Patel4 min read
The Earnings Gap
Every valuation framework runs into the same problem with high-growth companies: they often have no earnings. A SaaS company growing revenue at 50% annually while spending aggressively on customer acquisition will report negative net income for years. P/E is undefined. EV/EBITDA is negative. The standard toolkit breaks down.
This is where price-to-sales (P/S) enters. By comparing market capitalization to revenue, P/S provides a valuation anchor for companies that have crossed the revenue threshold but have not yet reached profitability. It is the most commonly used metric for early-stage public companies, and it is also one of the most abused.
How P/S Works
Price-to-sales divides market capitalization by trailing twelve-month revenue. A company with a $5 billion market cap and $500 million in revenue trades at 10x sales. The enterprise value variant (EV/Sales) is slightly more precise because it accounts for debt and cash, but the interpretation is similar.
The logic is that revenue is harder to manipulate than earnings. You can shift expenses between quarters, change depreciation schedules, or adjust reserves to manage earnings. Revenue, while not immune to accounting games, is a more objective measure of business activity.
P/S also provides consistency across companies with different margin profiles, capital structures, and maturity stages. Two companies with identical revenue but different levels of profitability will have the same P/S ratio, which isolates the growth and revenue quality question from the profitability question.
What the Ranges Mean
P/S ratios vary enormously, and context is everything:
- Below 1x: Extremely cheap or deeply distressed. Mature retailers, commodity businesses, and companies in secular decline often trade here. Occasionally a genuine bargain, but typically reflects poor economics.
- 1-3x: Standard range for mature, moderate-growth businesses with reasonable margins. Most S&P 500 companies fall here.
- 3-8x: Growth premium. The market expects margin expansion, accelerating revenue, or both. Common for companies growing 20-30% annually with proven business models.
- 8-15x: High-growth territory. Typically reserved for companies growing 30%+ with strong unit economics and large addressable markets. Palantir, Datadog, and CrowdStrike have all traded in this range during growth phases.
- Above 15x: Speculative territory. At 15x sales, a company needs to grow into its valuation by either expanding revenue dramatically or achieving extraordinary margins. Very few companies sustain these multiples long-term.
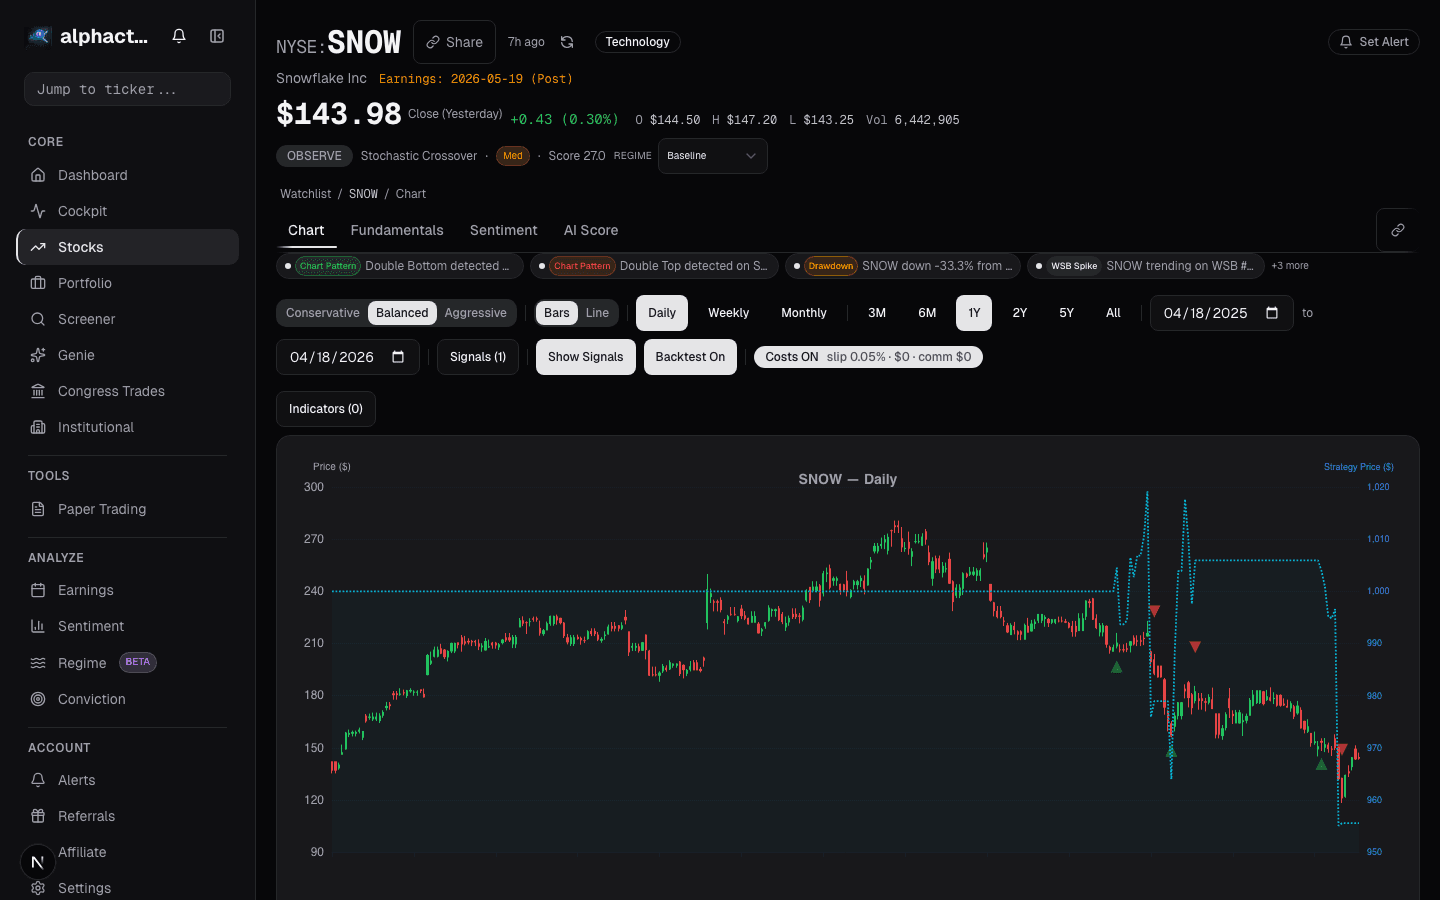
The 2021 bubble demonstrated the danger at the extreme end. Dozens of SaaS and fintech companies traded above 30x sales. Snowflake peaked above 80x. When growth decelerated and interest rates rose, many of these stocks fell 60-80% as multiples compressed to single digits.
The Unit Economics Test
P/S alone is incomplete. Two companies at 10x sales with 80% gross margins and 30% gross margins are in completely different positions. The first will eventually convert a large share of revenue into profit. The second may never generate meaningful earnings regardless of scale.
When using P/S to value a pre-profit company, the critical follow-up questions are:
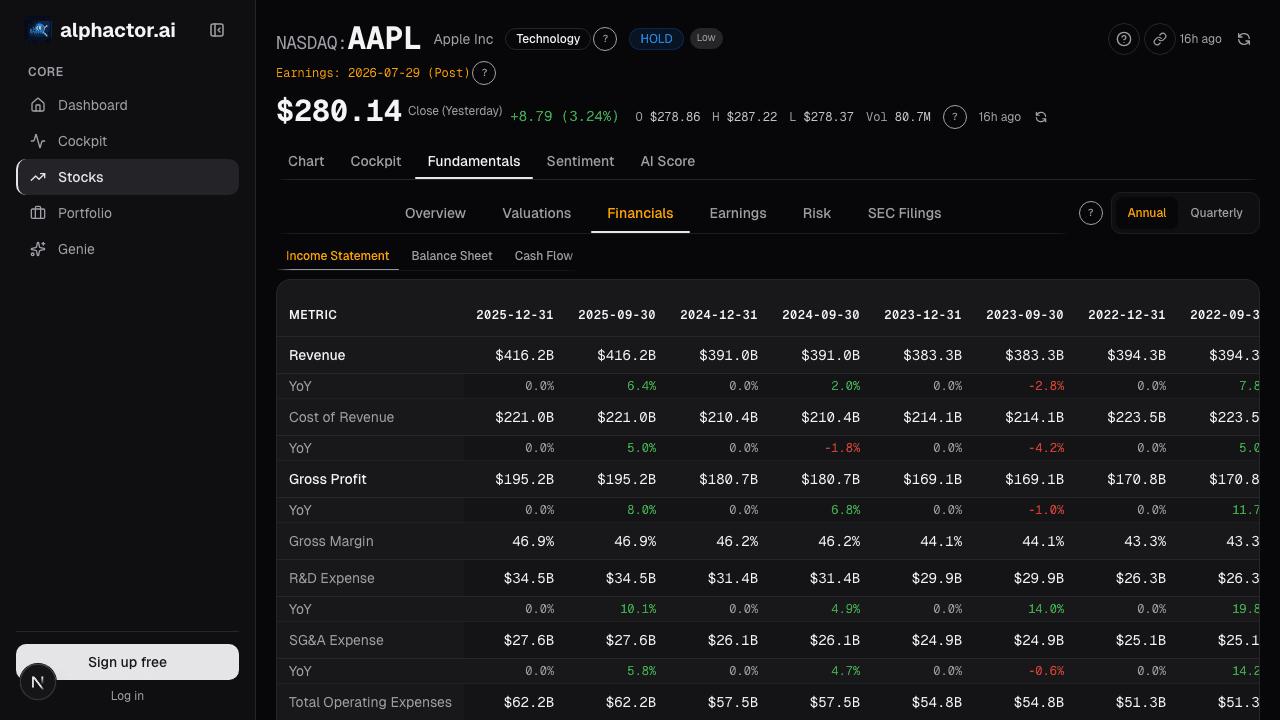
What are the gross margins? Software companies at 75%+ gross margins have a clear path to profitability through operating leverage. Hardware or services companies at 30% gross margins face a much harder road.
What is the revenue growth rate? P/S must be evaluated against the growth trajectory. A company at 15x sales growing 60% annually is at roughly the same forward multiple as one at 8x sales growing 15%. The growth rate determines how quickly the company grows into its valuation.
What does the mature margin profile look like? Every pre-profit company implicitly promises future margins. The question is what those margins will be once growth spending normalizes. If the best comparable mature companies in the sector earn 25% operating margins, that sets a ceiling for your profitability assumptions.
Is revenue recurring? A SaaS company at 10x sales with 95% net revenue retention is more defensible than a transactional business at 10x sales where customers can churn at will.
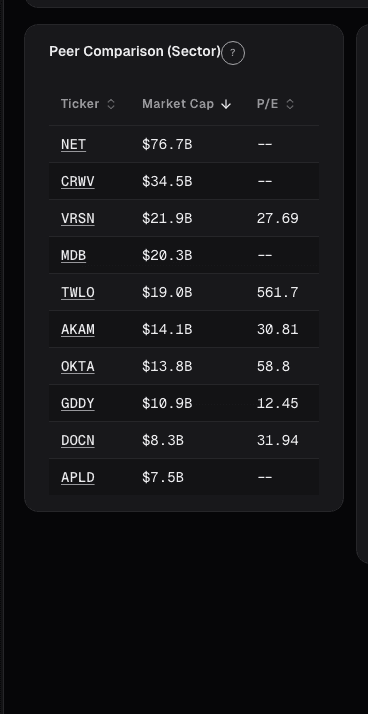
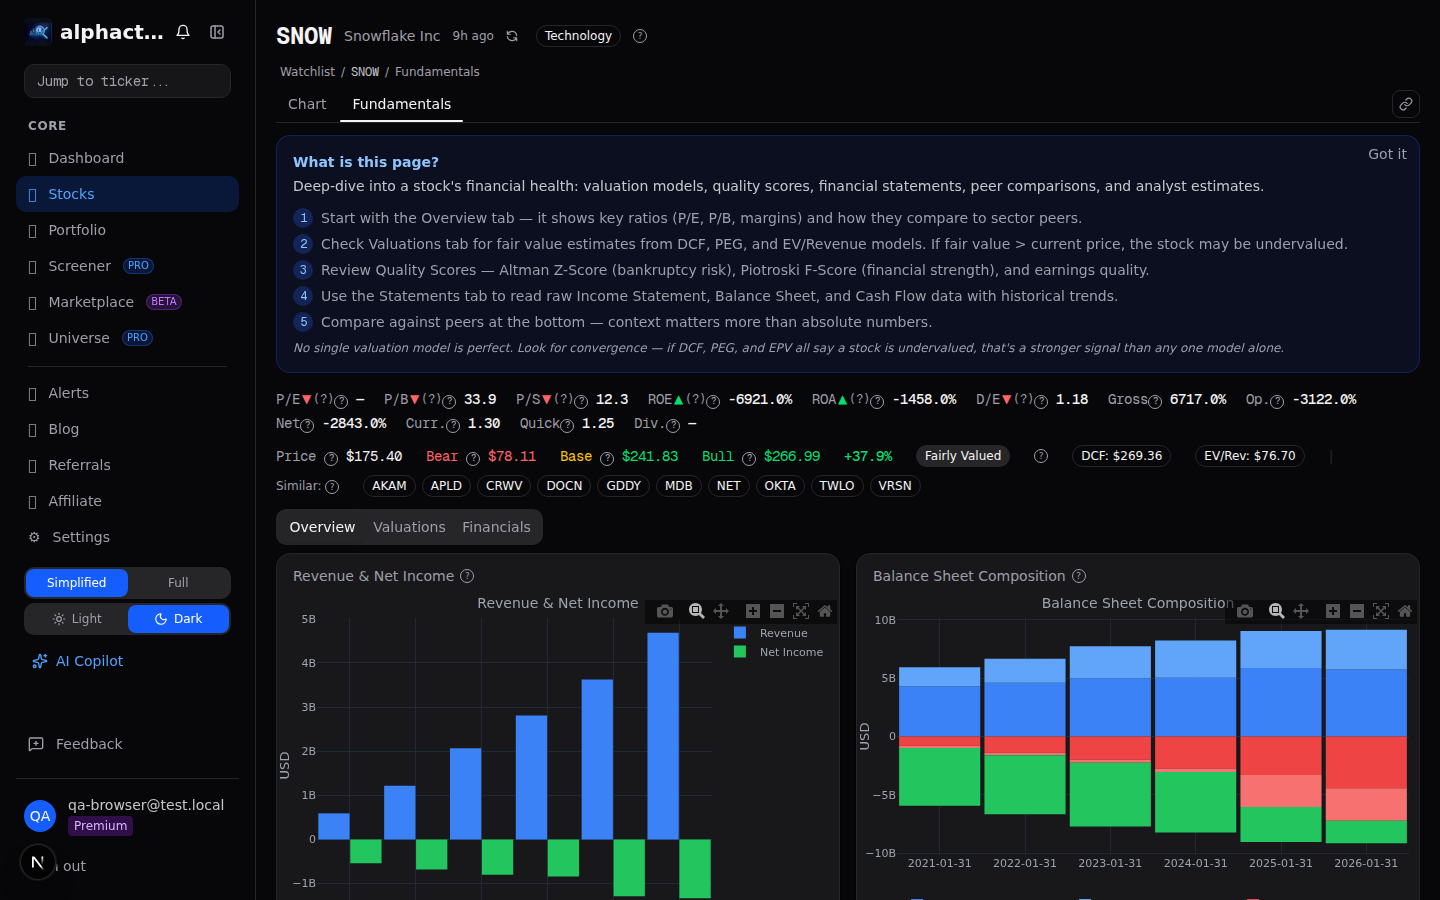
Alphactor's fundamentals view shows P/S alongside gross margins, revenue growth rates, and peer comparisons, giving you the context needed to evaluate whether a growth multiple is justified.
The Rule of 40
The Rule of 40 has become a standard framework for evaluating growth-stage software companies. It states that a healthy SaaS company's revenue growth rate plus its profit margin (typically EBITDA or free cash flow margin) should equal or exceed 40%.
A company growing 50% with a negative 10% margin scores 40, which passes. A company growing 15% with 25% margins also scores 40. Both are considered healthy, just at different stages.
Practical Application
When analyzing growth stocks, use the universe scanner to screen for P/S relative to the company's own historical range and its peer group.
!Price-to-sales ratio with growth rate context A company that has historically traded at 8-12x sales and currently sits at 6x might be interesting. The same company at 20x requires a strong thesis for why something has fundamentally changed.
Layer in gross margins, growth rate, net retention, and the Rule of 40 score to build a complete picture. P/S is a useful starting point for pre-profit companies, but it is never a conclusion. The metric tells you what the market is paying. The fundamentals tell you what the business is worth.
See it in the app
Live dashboard views that match this post. Each tile deep-links to the exact card.

Stocks mentioned
Related reading
EV/Revenue: The Multiple That Survives When Earnings Don't
EV/Revenue survives where P/E breaks, but needs a growth bridge. Pre-profit software mid-cycle runs 0.2-0.4x growth-adjusted, how to avoid the reading traps.
FCF Yield: What You're Actually Earning Today
FCF yield answers the most basic question in equity investing: if I buy this company today, how much cash does it throw off per dollar?
Earnings Power Value
EPV asks what a company is worth assuming zero growth, forever. The gap between EPV and market cap is the growth premium.
PEG Ratio: A Growth-Adjusted P/E, Less Naive Than It Looks
Naive PEG ignores growth quality and buyback distortions. The fix: use 3-5 year organic EPS CAGR and compare only within a profit-consistent peer group.
Not All Revenue Growth Is Created Equal
Why the source and sustainability of revenue growth matters more than the headline number, and how to distinguish organic growth from accounting illusions.
Ready to try alphactor.ai?
Validate your trading strategies with statistical credibility testing. Start free.
Get Started Free