Part of: Fundamental Analysis
Why Free Cash Flow Matters More Than Earnings
Earnings can be managed. Cash flow cannot. How to use free cash flow to evaluate business quality and avoid accounting illusions.
 Sarah Patel4 min read
The Problem with Earnings
Wall Street runs on earnings per share. Stocks gap up or down 10% based on whether a company beat consensus EPS by two cents. Entire careers are built around predicting that number. And yet, net income is one of the most manipulable figures on a financial statement.
Companies choose depreciation schedules, decide when to recognize revenue, time one-time charges, capitalize or expense costs, and adjust reserves. None of this is illegal. It is the normal flexibility built into accounting standards. But it means that two companies with identical economic realities can report meaningfully different earnings.
Free cash flow cuts through this. It measures what actually matters: how much cash did the business generate after paying for everything it needs to keep operating?
Defining Free Cash Flow
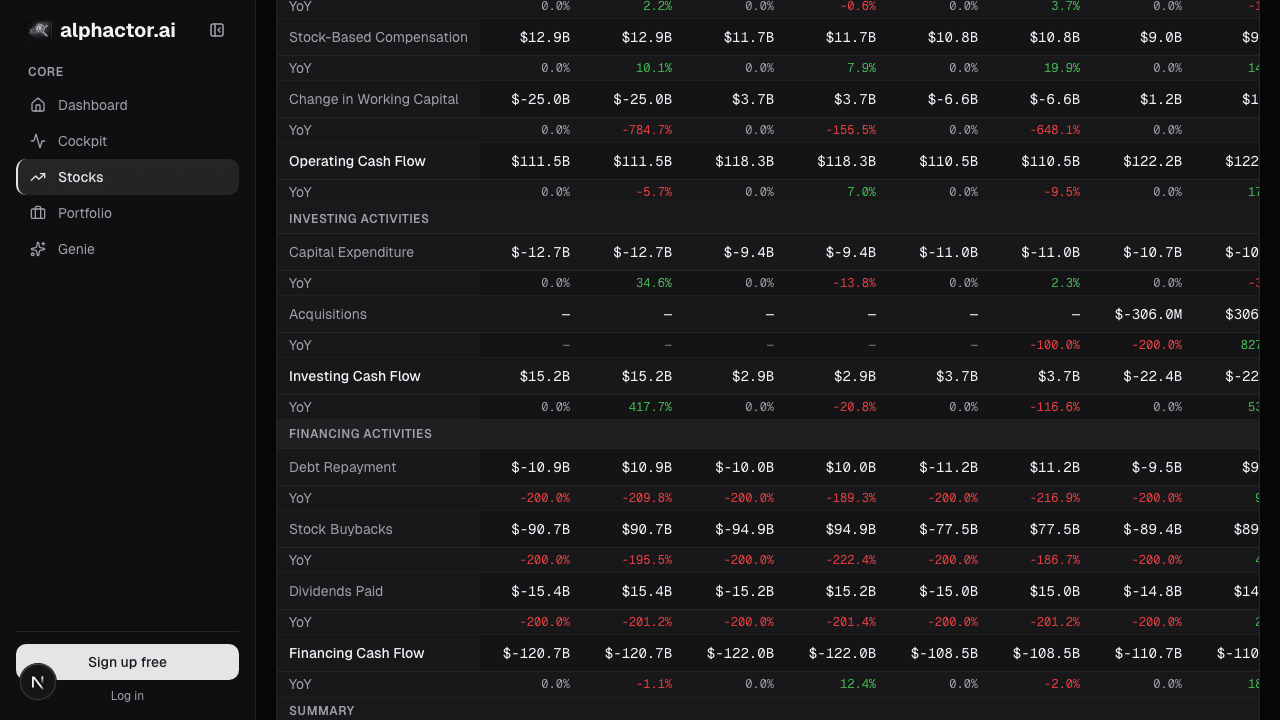
Free cash flow (FCF) equals cash flow from operations minus capital expenditures. That is it. Cash from operations starts with net income but adds back non-cash charges (depreciation, amortization, stock-based compensation) and adjusts for changes in working capital. Capital expenditures cover the money spent on property, equipment, and other long-lived assets required to sustain the business.
The result is the cash available to pay dividends, buy back shares, reduce debt, fund acquisitions, or simply accumulate on the balance sheet. It is the lifeblood of shareholder returns.
Where Earnings and Cash Flow Diverge
The divergence between earnings and free cash flow is often the most interesting signal in a financial statement. Consider a few common scenarios:
High earnings, low cash flow. This is a red flag. It typically means aggressive revenue recognition (booking revenue before cash arrives), rising accounts receivable, or heavy capitalization of expenses that should be flowing through the income statement. Luckin Coffee reported strong earnings growth for years before it turned out a significant portion of revenue was fabricated. The cash flow statement told a different story.
Low earnings, high cash flow. This can be attractive. Companies with heavy depreciation, such as REITs or infrastructure firms, often report modest net income while generating substantial cash. Amazon famously reported thin profits for years while generating billions in operating cash flow, reinvesting aggressively and compounding the business.
Earnings growing, cash flow shrinking. This pattern demands investigation. If a company reports 15% earnings growth but free cash flow declined, something is off. Working capital might be deteriorating (inventory piling up, customers paying slower), or capex is rising faster than revenue. Neither bodes well.
The Quality Test
One of the most useful checks in fundamental analysis is the cash conversion ratio: free cash flow divided by net income. A ratio consistently above 1.0 means the company converts more than 100% of its reported earnings into actual cash. That is a sign of high-quality earnings.
Companies like Visa, Microsoft, and Costco routinely show cash conversion ratios above 1.0. Their businesses are capital-light, their customers pay quickly, and their reported earnings closely track economic reality.
A ratio persistently below 0.7 deserves scrutiny. It means the company is spending significantly more cash than its earnings suggest, either through heavy capex, deteriorating working capital, or accounting that flatters the income statement.
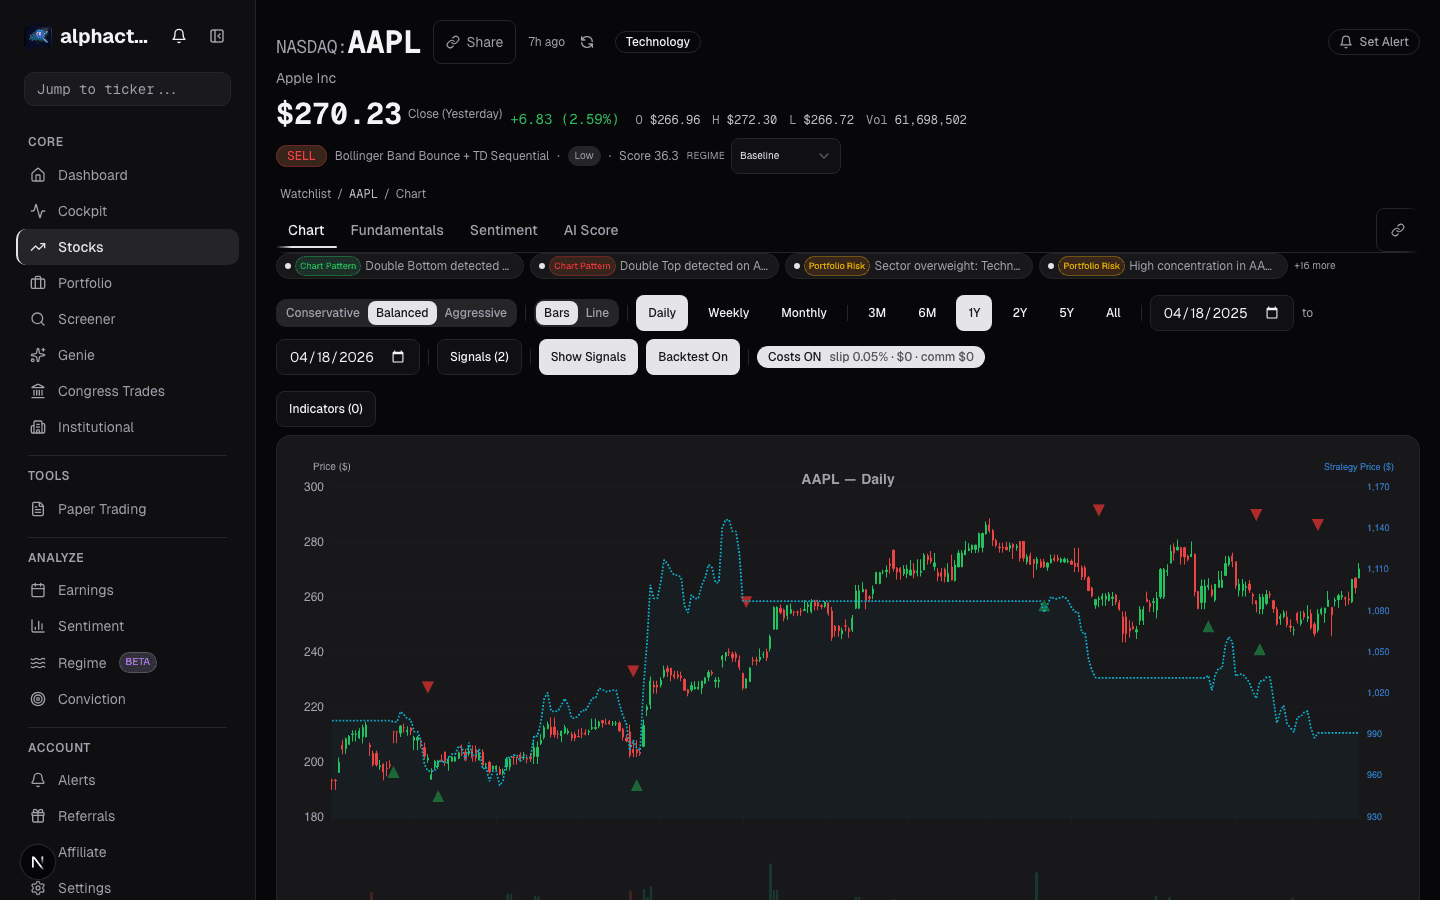
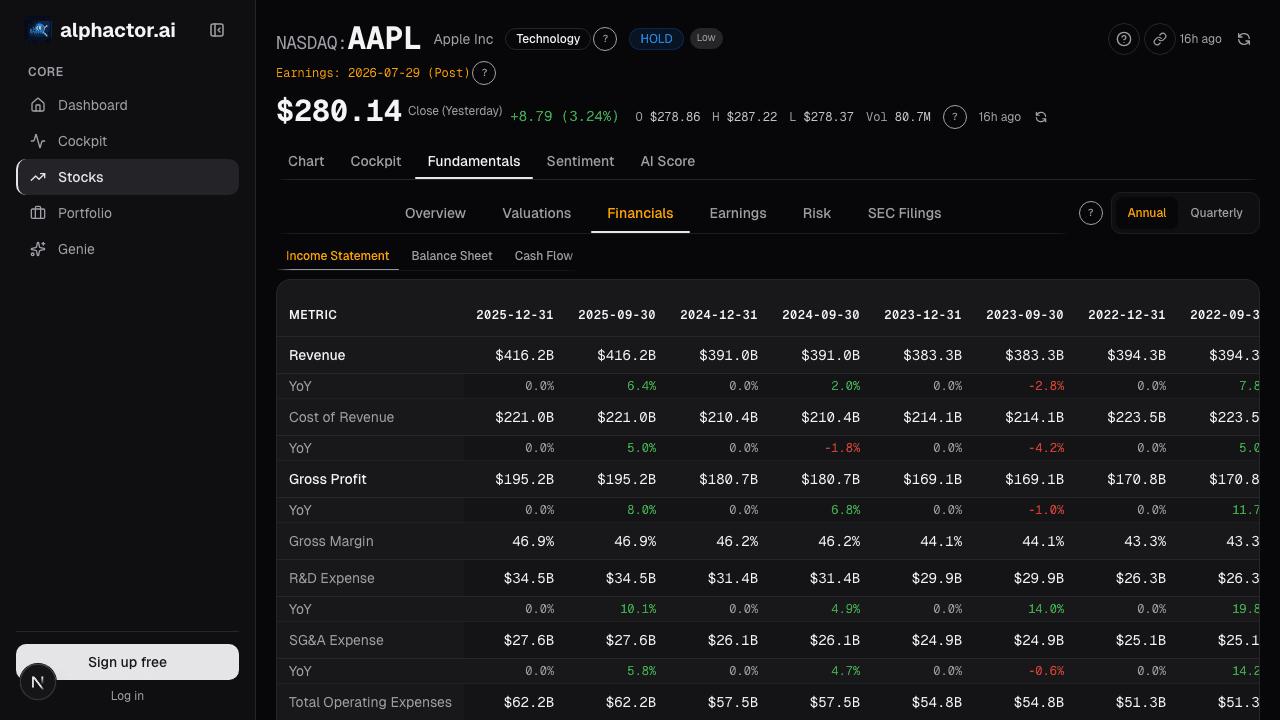
Alphactor's fundamentals view surfaces free cash flow alongside earnings, making it easy to spot divergences over time. The stock comparison feature also ranks companies within their sector on FCF yield, one of the most reliable valuation metrics available.
FCF Yield: Valuation That Matters
Price-to-free-cash-flow, or its inverse FCF yield, is a powerful valuation tool. FCF yield divides free cash flow per share by the stock price. A stock at $100 generating $8 per share in free cash flow has an 8% FCF yield.
As of mid-2025, the S&P 500 median FCF yield sits around 3.5-4%. Stocks yielding 6% or more on a sustained basis, assuming the cash flow is real and maintainable, are generating meaningful returns for shareholders regardless of what the stock price does in any given quarter.
Compare that to the earnings yield (inverse of P/E), which includes non-cash items and accounting discretion. FCF yield measures actual cash available to you as an owner.
Exceptions and Caveats
Free cash flow is not perfect. High-growth companies legitimately reinvesting in the business, building warehouses, expanding capacity, investing in R&D, will show low or negative FCF even when the investments are value-creating. Amazon's FCF in its hypergrowth phase was misleading in isolation because the capex was funding massive future cash generation.
The key question is whether capital expenditures are maintenance (required to sustain current operations) or growth (expanding future capacity). Most companies do not break this out, but you can approximate it by looking at capex as a percentage of revenue over time. Stable ratios suggest maintenance; rising ratios suggest investment cycles.
The Bottom Line
When you read an earnings release, look past the headline EPS number. Find the cash flow statement. Compare free cash flow to net income over multiple years. If the business consistently turns reported profits into actual cash, you are looking at a high-quality operation. If cash flow chronically lags earnings, the income statement is telling you a story that the bank account does not support.
See it in the app
Live dashboard views that match this post. Each tile deep-links to the exact card.

Stocks mentioned
Related reading
Accruals Quality: How to Spot Earnings That Aren't Real
Accruals measure the gap between reported earnings and actual cash. Widening accruals is one of the most reliable red flags in financial analysis, Sloan's…
Altman Z-Score: A Bankruptcy Predictor That Still Works
Edward Altman's 1968 discriminant model predicts bankruptcy within two years about 72% of the time at its distress threshold.
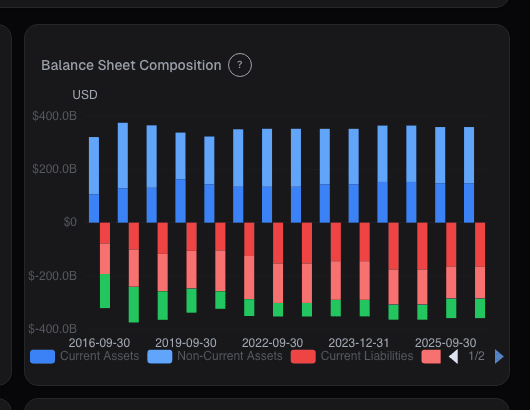
Balance Sheet Deep Dive
Balance sheet changes lead income statements by 2-6 quarters. Net debt, receivables days, and goodwill are the lines that move stocks first.
FCF Yield: What You're Actually Earning Today
FCF yield answers the most basic question in equity investing: if I buy this company today, how much cash does it throw off per dollar?
TradingView vs alphactor.ai
TradingView leads for charting and Pine Script. Alphactor adds an 8-layer credibility pipeline with walk-forward validation and Deflated Sharpe Ratio testing.
Ready to try alphactor.ai?
Validate your trading strategies with statistical credibility testing. Start free.
Get Started Free