Part of: Fundamental Analysis
Balance Sheet Deep Dive
Balance sheet changes lead income statements by 2-6 quarters. Net debt, receivables days, and goodwill are the lines that move stocks first.
 Sarah Patel7 min read
In 2019 a specialty retailer I'd been following reported an earnings beat, reaffirmed full-year guidance, and the stock gapped up 8%. I'd passed on the name six months earlier after spending an hour on its balance sheet. The inventory-to-sales ratio had been expanding for three consecutive quarters, meaning each incremental dollar of revenue required more inventory than the last. Goods were sitting on shelves longer. On the face of the income statement the quarter looked clean; on the balance sheet it didn't. Eighteen months later the company issued a $200M impairment charge against inventory, guided down for the subsequent year, and the stock fell 55% from the earnings-beat peak. The warning had been on the balance sheet the whole time. The earnings print was the misdirection.
This post is about the Balance Sheet card, why balance-sheet changes lead income-statement changes by 2–6 quarters, and the five lines that disproportionately move stocks.
TL;DR
- Balance sheet changes lead income statement changes. The balance sheet is the running measure of what the business *can* do; the income statement is what it *did*.
- Cash + net debt is the first thing to check. It's the ceiling on buybacks, dividends, and M&A capacity.
- Receivables days and inventory days are forward indicators. Rising either without revenue growth is a yellow flag.
- Goodwill as a share of equity is write-down risk waiting to happen. For acquisitive companies, track it.
- Common-size (% of total assets) is more comparable across years than absolute dollars. Use the toggle.
Balance sheet changes lead income statement changes
The income statement is a report on a period, what the business did in the last three months. The balance sheet is a snapshot, what the business looks like right now. That matters because future income-statement outcomes are constrained by current balance-sheet state. Growing receivables are future cash collection (or future write-off, if the collection fails). Expanding inventory is future cost of goods sold (or future markdown, if it doesn't sell). Shrinking cash is a binding constraint on future buybacks or M&A. None of this shows up in EPS until it's too late to reposition.
That's why the disciplined analyst spends as much time on the balance sheet as on the income statement, sometimes more, especially for cyclicals, financials, and anything with significant debt. The retail error is reading the income statement and calling it done. The professional read layers the balance sheet on top and looks for divergence: Did revenue grow 20% while receivables grew 35%? Did inventory grow faster than revenue? Did goodwill balloon from a recent acquisition? These are the signals income-statement-only analysis misses.
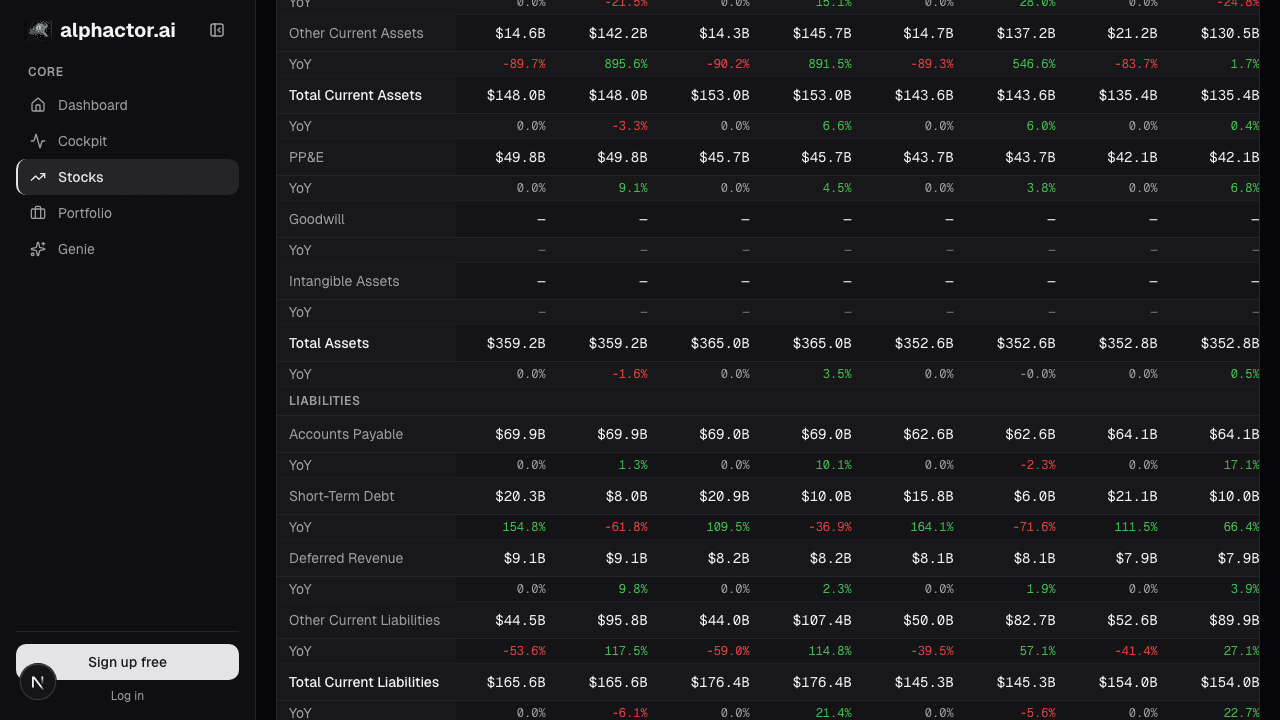
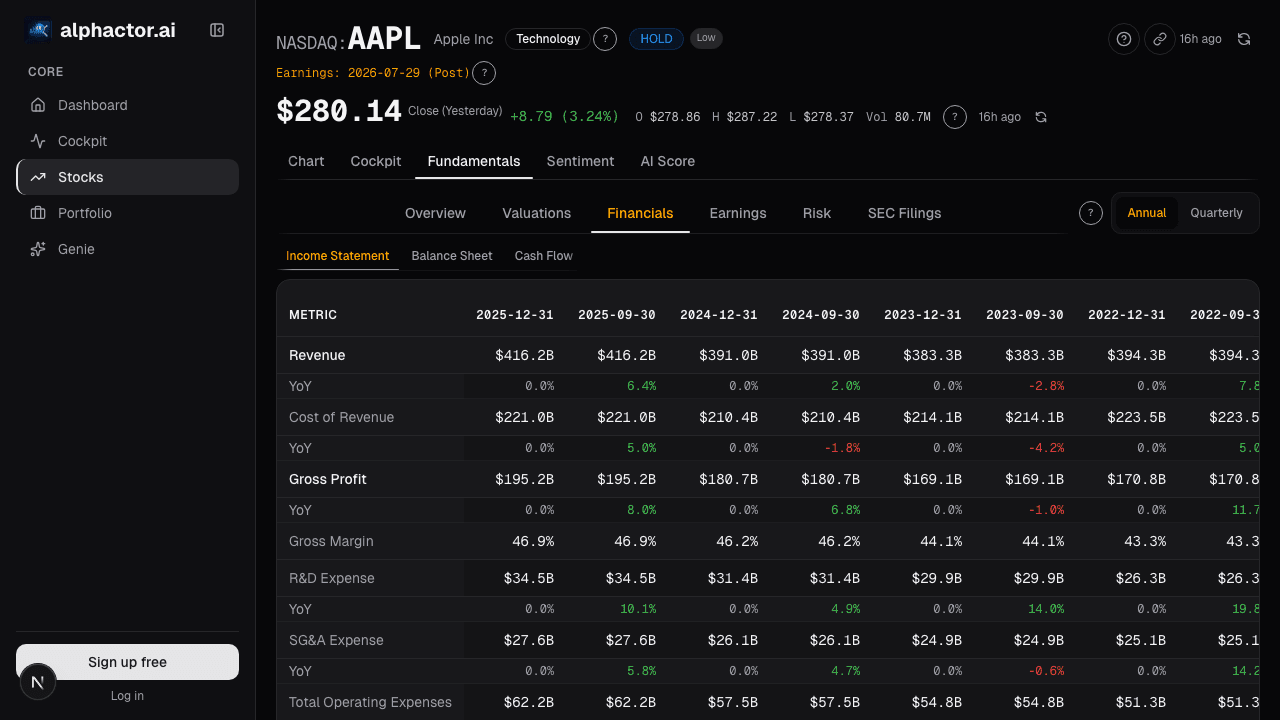
What the Balance Sheet card shows
The Balance Sheet card presents:
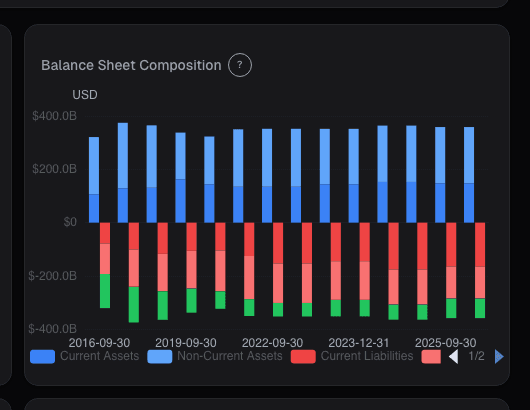
- Full quarterly balance sheet for up to 20 periods (5 years), current vs non-current assets, current vs long-term liabilities, shareholder equity with buyback/issuance detail
- Common-size toggle normalizing every line as a % of total assets, which is more comparable across years than absolute dollars
- Net-debt trend strip at the top showing the deleveraging/leveraging trajectory over 5 years
- Days metrics: days sales outstanding (receivables / daily revenue), days inventory outstanding, days payable outstanding, cash conversion cycle
- Debt maturity schedule pulled from the latest 10-K, year-by-year debt coming due, color-coded against near-term refinancing risk
- Financials-specific view for banks and insurers, replaces the conventional asset categorization with loan-book vs securities composition, risk-weighted assets, tangible book value
Five lines that move stocks
Cash + short-term investments. Liquid dry powder, the ceiling on buyback or acquisition plans. When cash grows faster than operating needs, it's either signaling an impending M&A deploy, an expanded buyback, or management conservatism ahead of a weaker operating period. When cash declines faster than buyback + dividend + capex would explain, check for working-capital or refinancing pressure. For most companies, cash trajectory is a 6-month-ahead read on capital return plans.
Long-term debt maturity schedule. In a rising-rate environment, refinancing walls compress margins because old debt rolls to higher rates. The 10-K discloses year-by-year maturities; the card pulls them into a schedule visualization. A company with $2B of 3%-coupon debt maturing in the next 18 months faces ~$60M/year of incremental interest expense if it refinances at 6%, material to EPS for many mid-cap industrials. The card flags names with concentrated near-term walls.
Goodwill + intangibles as % of equity. Goodwill is the premium paid over book value in acquisitions. High goodwill relative to shareholder equity means a large impairment charge is possible if the acquired business disappoints. For companies that have made large acquisitions (often called "acquisition roll-ups"), goodwill can exceed total shareholder equity, meaning any impairment writes the equity below zero. A single write-down doesn't bankrupt the company (it's non-cash) but it crushes the reported book value and the multiples that reference it.
Retained earnings trajectory. Retained earnings accumulate net income less dividends + buybacks over the company's life. A persistent decline means dividends and buybacks are being funded from borrowing rather than profit, the capital return is coming out of leverage, not from operations. For an unlevered company early in buyback cycles this can be fine; for an already-levered company it's a warning that the capital return policy is unsustainable without continued debt issuance.
Accounts receivable days. Expanding receivables without corresponding revenue growth is a quality warning. The simplest interpretation is customers paying more slowly (cyclical weakness), but the more concerning version is revenue recognition that's running ahead of actual cash collection (accrual manipulation). The same signal the Accruals Quality card picks up; the balance sheet is where it's visible first.
Example: reading two industrials side by side
Two mid-cap industrials in Q2 2025:
| Metric (TTM) | Company A | Company B |
|---|---|---|
| Revenue growth YoY | +8% | +7% |
| EPS growth YoY | +12% | +9% |
| Cash / total assets | 18% | 5% |
| Net debt / EBITDA | 0.9× | 3.4× |
| Goodwill / equity | 22% | 68% |
| DSO (days sales outstanding) | 48 | 67 (up from 54) |
| Debt maturing next 18mo | $150M (14% of debt) | $820M (62% of debt) |
On headline growth the two look similar. The balance sheet is where they separate: A has deleveraging room, low goodwill risk, stable collection. B is highly leveraged, goodwill-heavy, with receivables days extending and a concentrated refinancing wall. In a rate environment where B has to refinance at higher coupons, its incremental interest expense alone could compress next year's EPS 10–15%. The forward risk is asymmetric, and the balance sheet is where it's visible. A P/E comparison would mostly miss this. My read: long A, pass on B. The market eventually priced the difference.
What the balance sheet can mask
- Off-balance-sheet arrangements. Operating leases used to sit off-balance-sheet pre-ASC 842 / IFRS 16. Cross-entity guarantees, SPE (special-purpose entity) commitments, and certain derivative exposures still partially sit off-balance-sheet. Read the 10-K commitments & contingencies footnote.
- Accounting-standard changes. ASC 842 (US lease accounting) in 2019 moved operating leases on-balance-sheet, distorting long-term comparisons. The card normalizes where possible but history-chart readers should be aware of the 2019 step-change.
- M&A impact on comparability. A large acquisition changes every line on the balance sheet in one quarter, making trend analysis broken. The card flags M&A quarters so you can read through them.
- Pension / post-retirement obligations. Large for some industrials, understated on-balance-sheet. The 10-K footnotes disclose the actual obligation vs. the balance-sheet representation.
Common mistakes
- Reading the balance sheet in isolation. Always read against the income statement and cash flow statement; the three together tell the full story.
- Ignoring common-size. Absolute dollars grow with the business; % of total assets is comparable across years. Use the toggle.
- Treating goodwill as neutral. It's not. High goodwill is write-down risk and signals an aggressive acquisition strategy that may not integrate well.
- Skipping the debt maturity schedule. Refinancing walls are the single most overlooked risk in mid-cap credit analysis.
- Assuming retained earnings always grows. It doesn't. Persistent declines are a capital-return quality warning.
Where it fits
Cross-reference with Leverage for ratio context, Altman Z-Score for bankruptcy probability estimation, and Cashflow Waterfall for the flow side of the capital picture. For acquisition-heavy names, also check Accruals Quality, goodwill and accruals are often correlated warnings.
FAQ
What's a healthy debt level?
Depends on the business. Asset-light software: near-zero debt is normal. Utilities and REITs: 3–5× net debt/EBITDA is standard. What matters is debt relative to business cash generation and relative to the sector median. The card shows both.
How do I interpret a buyback that reduces shareholder equity?
Buybacks decrease equity by the cost of the shares retired, which is fine and expected. Watch for debt-funded buybacks on already-levered companies, that's equity shrinking while debt grows, weakening the balance sheet structurally.
Why does goodwill matter if it's non-cash?
It's non-cash on the income statement if impaired, but the impairment is real accounting value destruction that affects book-based valuation multiples, covenants tied to tangible book, and signals acquisition strategy problems.
Is this card usable for banks?
Yes, but use the bank-specific view, the conventional current/non-current asset split doesn't apply. Loan-book composition, deposit composition, and risk-weighted assets are the relevant categories.
How often does the card update?
On filing. 10-Q releases quarterly; 10-K annually. The card reflects the latest filing within hours of it appearing on EDGAR.
Related reading
- Balance Sheet Snapshot Chart
- Accruals Quality, Earnings Manipulation
- Altman Z, Bankruptcy Risk
- Cashflow Waterfall
Open the Balance Sheet card → /app/stocks/AAPL/fundamentals
See it in the app
Live dashboard views that match this post. Each tile deep-links to the exact card.

Stocks mentioned
Related reading
Accruals Quality: How to Spot Earnings That Aren't Real
Accruals measure the gap between reported earnings and actual cash. Widening accruals is one of the most reliable red flags in financial analysis, Sloan's…
Altman Z-Score: A Bankruptcy Predictor That Still Works
Edward Altman's 1968 discriminant model predicts bankruptcy within two years about 72% of the time at its distress threshold.
Cashflow Waterfall: From Operating Cash to Free Cash
Operating cash flow is cleaner than net income but still not distributable cash. The waterfall makes every deduction visible, SBC, working capital, capex …
Debt-to-Equity Ratio
How to evaluate a company's debt load, when leverage creates value, when it destroys it, and the sector-specific thresholds that matter.
The Dividend Yield Trap: When High Yield Signals Danger
Why chasing the highest dividend yields is one of the most common mistakes income investors make, and how to identify sustainable dividends.
Earnings Season Checklist: What to Watch Before, During
A structured approach to earnings season: how to prepare, what metrics matter on the call, and how to interpret post-earnings price action.
Ready to try alphactor.ai?
Validate your trading strategies with statistical credibility testing. Start free.
Get Started Free