Part of: Fundamental Analysis
The Dividend Yield Trap: When High Yield Signals Danger
Why chasing the highest dividend yields is one of the most common mistakes income investors make, and how to identify sustainable dividends.
 Sarah Patel4 min read
The Seduction of High Yield
A stock yielding 8% when Treasuries pay 4.5% looks like a gift. The math seems irresistible: invest $100,000, collect $8,000 per year, reinvest, and compound your way to a comfortable retirement. Income-focused investors, particularly retirees, are drawn to high-yield stocks like moths to a light.
The problem is that a stock yielding 8% is often yielding 8% because the stock price has collapsed. Dividend yield is calculated by dividing the annual dividend by the current stock price. When the price drops 40%, the yield mechanically doubles, even if the dividend itself has not changed and is about to be cut.
This is the dividend yield trap, and it catches investors every cycle.
How the Trap Works
Consider a stock that paid a $2 annual dividend while trading at $50, a 4% yield. The company reports disappointing earnings, issues weak guidance, and the stock falls to $25. The yield jumps to 8%. Income screeners light up. Value investors take notice.
But the market was not being irrational. The earnings decline means the company can no longer comfortably cover its dividend. Its payout ratio (dividends divided by earnings) has jumped from 50% to 95%. Free cash flow barely covers the distribution. Six months later, management cuts the dividend by 50%, and the stock drops another 20%.
The investor who bought for the 8% yield is now sitting on a 40% capital loss and a reduced dividend. The total return is deeply negative.
This pattern repeats constantly. AT&T's dividend looked safe for years until the company cut it by 47% in 2022 to fund its restructuring. General Electric spent a decade cutting its once-sacred dividend. Dozens of energy companies slashed dividends during the 2020 oil price collapse.
The Payout Ratio Is the First Check
Dividend sustainability starts with the payout ratio. There are two versions worth examining:
Earnings payout ratio (dividends per share divided by earnings per share) should ideally sit below 60% for most companies and below 75% for utilities and REITs. Above 80%, the company is distributing nearly all its earnings, leaving minimal margin for error.
Free cash flow payout ratio (total dividends paid divided by free cash flow) is even more telling because it measures actual cash, not accounting earnings. A company paying out 90% of its free cash flow has no room for capex increases, debt reduction, or earnings disappointments.
When both ratios are stretched, the dividend is living on borrowed time. When they are diverging, with the earnings ratio looking fine but the FCF ratio looking strained, it often means earnings quality is poor and cash is tighter than reported profits suggest.
What Sustainable Dividends Look Like
Companies with durable, growing dividends share several characteristics:
Stable, recurring revenue. Businesses with subscription models, long-term contracts, or essential products generate the predictable cash flows that support consistent dividends. Procter & Gamble has increased its dividend for over 65 consecutive years because people keep buying toothpaste and detergent regardless of the economy.
Moderate payout ratios. The best dividend payers distribute 40-60% of earnings, retaining enough to reinvest in the business and build a buffer against downturns. Johnson & Johnson, with its decades-long dividend growth streak, has historically maintained a payout ratio in this range.
Strong balance sheets. Companies with low debt and ample cash reserves can maintain dividends through recessions. A company entering a downturn with 3x debt-to-equity and a 75% payout ratio is a dividend cut waiting to happen.
Growing free cash flow. Dividends can only grow sustainably if the underlying cash generation is growing. Flat cash flow with a rising dividend means the payout ratio is expanding, which is unsustainable.
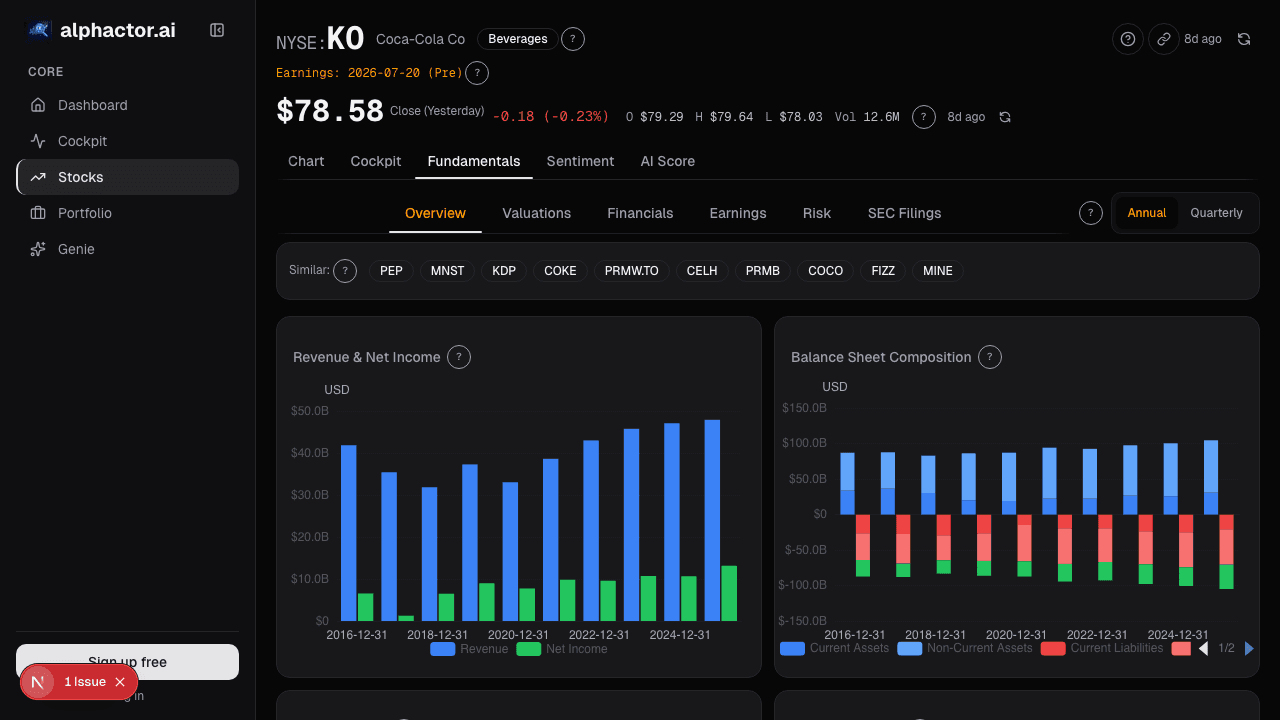
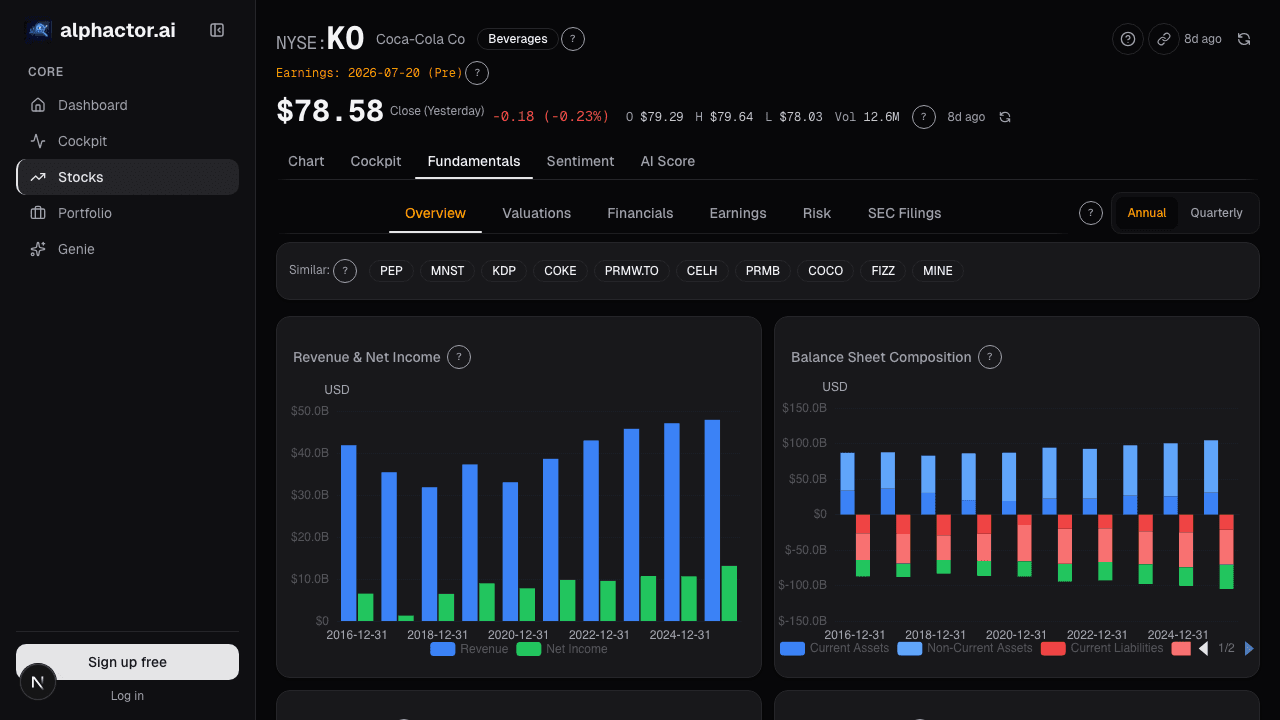
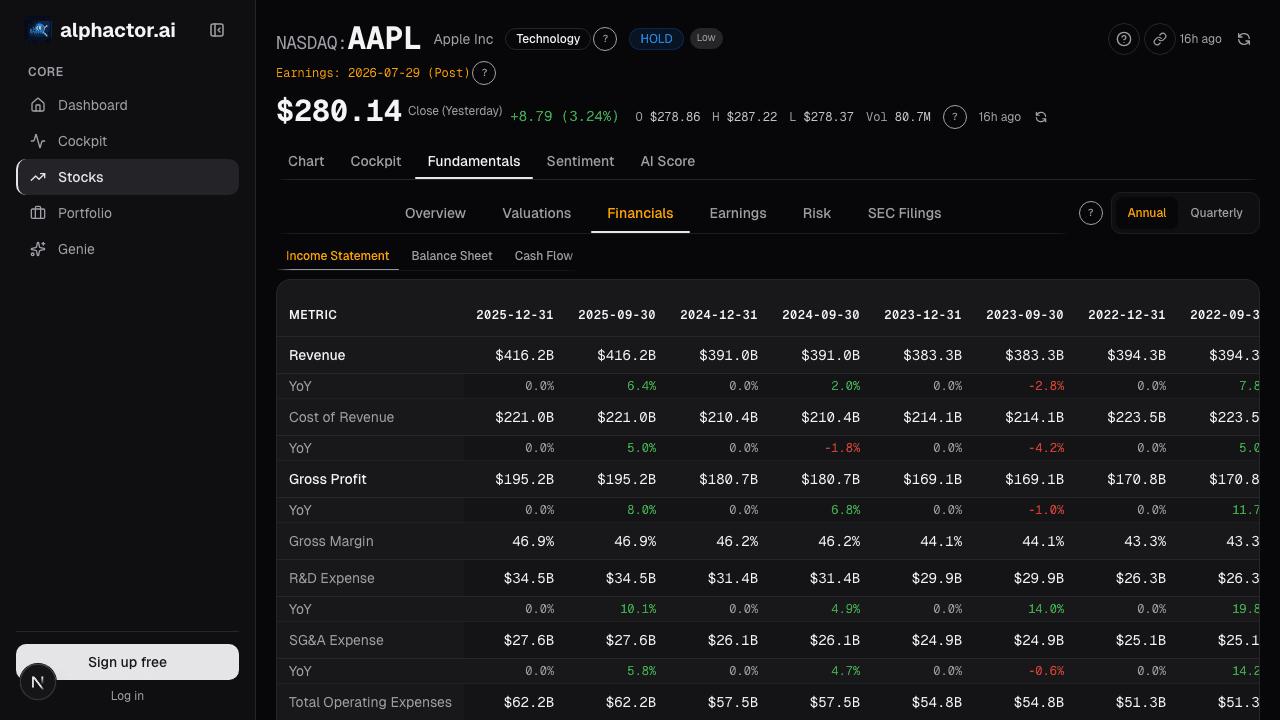
Alphactor's fundamentals view displays dividend yield alongside payout ratios, free cash flow coverage, and debt metrics, giving you the complete picture of dividend sustainability rather than just the headline yield.
Red Flags to Watch
Several signals should prompt immediate investigation of a dividend's safety:
Yield significantly above sector median. If the sector averages 2.5% and a stock yields 6%, the market is pricing in a cut. You need a strong thesis for why the market is wrong.
Dividend growth stalling. A company that raised its dividend 8% annually for a decade and suddenly increases by only 1% is sending a signal. Management knows the business is slowing before analysts catch on.
Rising debt to fund dividends. Some companies borrow money to maintain their dividend streak. This is financial engineering, not shareholder returns. Check whether total debt is rising faster than operating cash flow.
Insider selling. If executives are selling shares while the company maintains a high yield, they may have better information about the dividend's sustainability than you do.
The Right Approach
Screen for dividends that can grow, not dividends that are currently the largest. With the universe scanner, sort by dividend growth rate over 5 years, then filter for payout ratios below 60% and positive free cash flow trends. The resulting list will underperform a high-yield screen in the first year and significantly outperform over any meaningful holding period. Income investing done right is about building a growing stream of cash flow from durable businesses.
See it in the app
Live dashboard views that match this post. Each tile deep-links to the exact card.

Stocks mentioned
Related reading
Accruals Quality: How to Spot Earnings That Aren't Real
Accruals measure the gap between reported earnings and actual cash. Widening accruals is one of the most reliable red flags in financial analysis, Sloan's…
Altman Z-Score: A Bankruptcy Predictor That Still Works
Edward Altman's 1968 discriminant model predicts bankruptcy within two years about 72% of the time at its distress threshold.
Balance Sheet Deep Dive
Balance sheet changes lead income statements by 2-6 quarters. Net debt, receivables days, and goodwill are the lines that move stocks first.
Price-to-Book Value: Useful for Banks, Misleading for Tech
Price-to-book works for banks and asset-heavy industrials but misleads for software. Here is how to apply it correctly by sector and when to skip it.
Cashflow Waterfall: From Operating Cash to Free Cash
Operating cash flow is cleaner than net income but still not distributable cash. The waterfall makes every deduction visible, SBC, working capital, capex …
Ready to try alphactor.ai?
Validate your trading strategies with statistical credibility testing. Start free.
Get Started Free