Part of: Risk Management
Debt-to-Equity Ratio
How to evaluate a company's debt load, when leverage creates value, when it destroys it, and the sector-specific thresholds that matter.
 Sarah Patel4 min read
Debt Is Not Inherently Bad
There is a persistent misconception among retail investors that debt is always a red flag. It is not. Debt is a tool. A company borrowing at 5% to invest in projects earning 15% is creating value for shareholders. The tax deductibility of interest payments further tilts the math in favor of reasonable leverage.
The problem is not debt itself. The problem is when companies take on debt they cannot service during downturns, when they borrow to fund share buybacks at inflated prices, or when leverage obscures deteriorating fundamentals.
The debt-to-equity ratio (total debt divided by shareholders' equity) is the most widely used gauge of leverage. A ratio of 0.5 means the company has half as much debt as equity. A ratio of 2.0 means it has twice as much debt as equity.
Where the Danger Lines Sit
There is no universal threshold for "too much debt." It depends entirely on the business model, the stability of cash flows, and the interest rate environment. That said, some rough guidelines apply:
- Below 0.5: Conservative. Common among cash-rich tech companies and well-run consumer staples firms. Apple's debt-to-equity has hovered around 1.5-1.8 in recent years, but its $60 billion in cash and equivalents makes the gross number misleading.
- 0.5-1.0: Moderate. Typical for established businesses with predictable revenue. Most S&P 500 industrials fall in this range.
- 1.0-2.0: Elevated. Acceptable for capital-intensive businesses with stable cash flows (utilities, telecoms), concerning for cyclical businesses.
- Above 2.0: Aggressive. Requires strong, predictable cash generation to service. Private equity-owned companies often operate here, which works until a recession tests the structure.
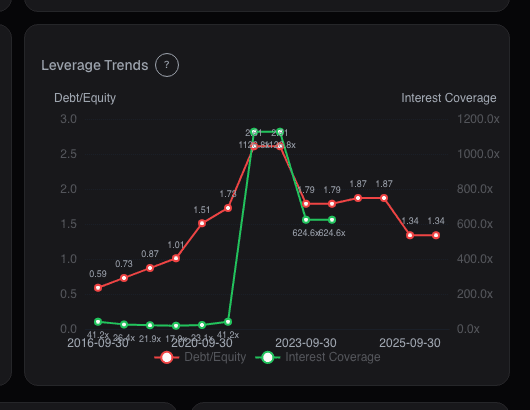
Always pair debt-to-equity with the interest coverage ratio (EBIT divided by interest expense). A company with a 1.5 debt-to-equity ratio and 8x interest coverage is in a fundamentally different position than one with the same leverage and 2x coverage. The first has ample room to absorb earnings volatility. The second is one bad quarter from covenant trouble.
Sector-Specific Norms
Comparing debt ratios across sectors is misleading. Some industries are structured around leverage:
Financials operate with debt-to-equity ratios of 5-10x by design. Banks borrow deposits and lend them at a spread. Their leverage is the business model, regulated by capital adequacy requirements rather than debt-to-equity thresholds.
Utilities commonly carry 1.0-1.5x debt-to-equity. Regulated rate structures provide revenue visibility that supports higher leverage. A utility at 1.2x is not risky in the way a software company at 1.2x would be.
Technology companies, especially mature ones, often carry minimal debt or hold net cash positions. When they do borrow, it is frequently to optimize their capital structure for tax efficiency rather than fund operations.
Real estate companies (REITs) use leverage extensively because the underlying assets are tangible and generate predictable rental income. Debt-to-equity of 0.8-1.2 is standard.
Alphactor's stock comparison feature benchmarks a stock's leverage against its sector group, which is the only comparison that makes sense.
The Warning Signs
Certain debt patterns reliably precede trouble:
Rapidly rising debt-to-equity. If the ratio has doubled in two years without a corresponding increase in revenue or assets, the company may be borrowing to cover operational shortfalls. Examine the cash flow statement to see where the borrowed money went.
Declining interest coverage. When EBIT-to-interest drops below 3x for a non-financial company, the margin of safety is thinning. Below 1.5x, the company is spending more than half its operating income on debt service.
Short-term debt concentration. A company with $5 billion in debt maturing within 18 months faces refinancing risk. If credit markets tighten or the company's credit rating deteriorates, refinancing may come at punitive rates or not at all. This is what brought down many companies in 2008.
Debt-funded buybacks at high valuations. Borrowing money to repurchase shares at peak multiples destroys value. The company increases its financial risk while buying an overpriced asset. Several large-cap companies learned this the hard way during the 2020 downturn, having spent billions on buybacks in 2018-2019 only to need emergency financing months later.
When Leverage Creates Value
Not all debt stories are cautionary tales. Leverage genuinely creates shareholder value when:
The borrowed capital earns a return well above the cost of debt. A company borrowing at 4% to fund projects generating 20% returns is using leverage intelligently.
The business has contractually stable cash flows. Infrastructure companies with long-term contracts, utilities with regulated rates, and subscription businesses with high retention all support leverage because their revenue is predictable.
Debt provides tax advantages without threatening solvency. The optimal capital structure balances the tax shield of debt against the risk of financial distress.
Practical Steps
On Alphactor, pull up the fundamentals view and examine debt-to-equity alongside interest coverage, debt maturity schedule, and free cash flow. The stock comparison shows where the company sits relative to its sector group on leverage.

The question is never whether a company has debt. It is whether the debt is sized appropriately for the cash flows supporting it and whether management is using it to create value or paper over weakness.
See it in the app
Live dashboard views that match this post. Each tile deep-links to the exact card.


Stocks mentioned
Related reading
Accruals Quality: How to Spot Earnings That Aren't Real
Accruals measure the gap between reported earnings and actual cash. Widening accruals is one of the most reliable red flags in financial analysis, Sloan's…
Altman Z-Score: A Bankruptcy Predictor That Still Works
Edward Altman's 1968 discriminant model predicts bankruptcy within two years about 72% of the time at its distress threshold.
Balance Sheet Deep Dive
Balance sheet changes lead income statements by 2-6 quarters. Net debt, receivables days, and goodwill are the lines that move stocks first.
Cashflow Waterfall: From Operating Cash to Free Cash
Operating cash flow is cleaner than net income but still not distributable cash. The waterfall makes every deduction visible, SBC, working capital, capex …
In a Crisis, All Correlations Go to One
Diversification fails exactly when you need it most. Here is why correlations spike during crises and how to build portfolios that survive it.
Ready to try alphactor.ai?
Validate your trading strategies with statistical credibility testing. Start free.
Get Started Free