Part of: Fundamental Analysis
How to Analyze Tech Stocks
The financial metrics that separate winning tech investments from hype-driven traps, with frameworks for evaluating SaaS, hardware, and platform businesses.
 Marcus Chen5 min read
TL;DR
- Revenue growth is only useful when it comes with durable margins, retention, and cash conversion.
- Gross margin separates software-like economics from hardware, services, or infrastructure-heavy models.
- Net revenue retention and Rule of 40 show whether growth is compounding efficiently or being bought with spend.
- Free cash flow and capital intensity tell you how much of the story can survive without fresh financing.
Revenue Growth Is Table Stakes
Every tech company pitches a growth story. Wall Street obliges by anchoring valuations to top-line expansion. But revenue growth alone tells you almost nothing about whether a tech stock is a good investment. Peloton grew revenue 172% in fiscal 2021 before losing 80% of its market cap. Zoom grew 326% the same year and followed a similar path down. Growth without durability is just a setup for mean reversion.
The metrics that actually differentiate long-term winners in technology are the ones that reveal the quality of growth: how sticky it is, how profitable it becomes, and how much capital it requires to sustain.
Gross Margin Reveals the Business Model
The single most underappreciated metric in tech analysis is gross margin, because it defines the ceiling on everything else. A pure software company like Adobe runs gross margins above 87%. A hardware-dependent company like GoPro sits around 35%. No amount of revenue growth closes that structural gap.
For SaaS businesses, gross margins above 75% indicate a scalable model where each incremental dollar of revenue costs almost nothing to deliver. Below 65%, you are looking at significant services revenue, infrastructure costs, or both, which limits operating leverage. Palantir spent years growing while burning cash in part because its delivery model was services-heavy, compressing margins that the market expected to look like pure software.
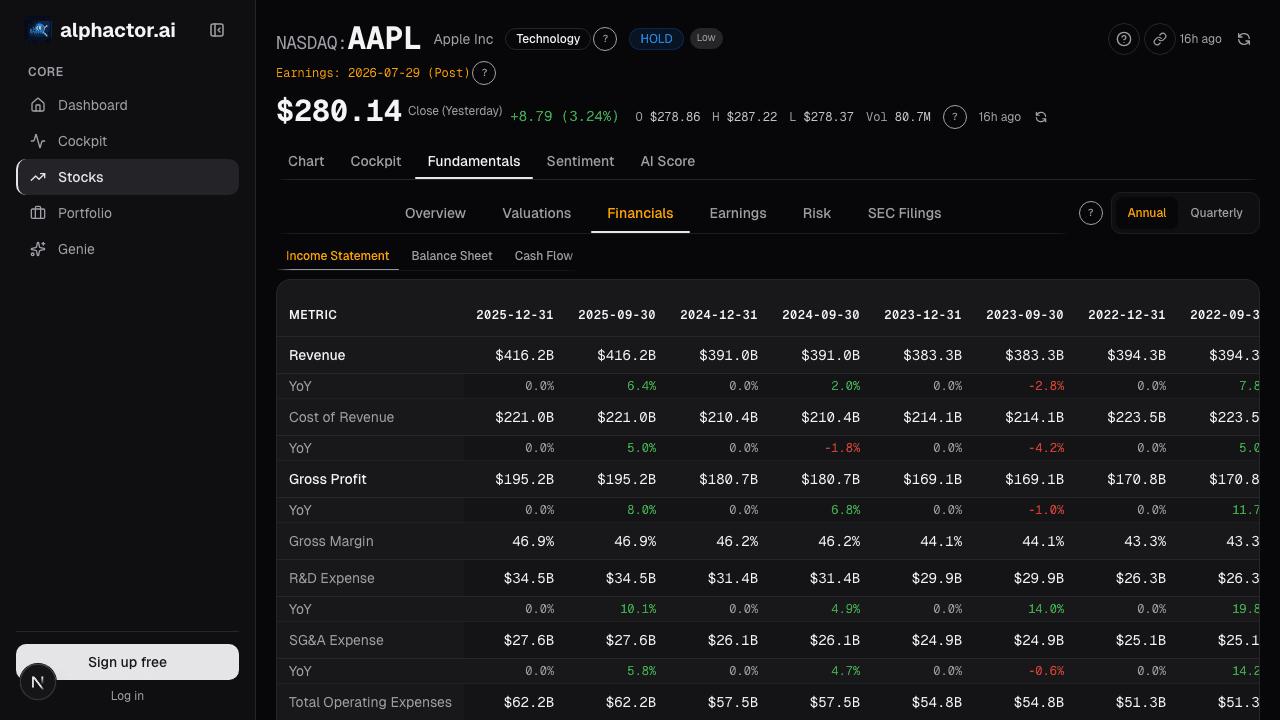
When comparing tech peers, Alphactor's fundamentals view lets you sort by gross margin within the technology sector, immediately surfacing which companies have structural margin advantages versus those masking services businesses behind software valuations.
Net Revenue Retention: The Growth Engine Inside the Base
For any subscription or recurring revenue business, net revenue retention (NRR) is arguably more important than new customer acquisition. NRR measures whether existing customers spend more over time (expansion) or less (contraction and churn).
A company with 130% NRR, like Snowflake has historically posted, grows 30% annually before signing a single new customer. That is a fundamentally different risk profile than a company growing 30% purely through new logos, which requires constant sales and marketing spend to sustain.

NRR above 120% is excellent. Between 100% and 120% is healthy. Below 100% means the existing customer base is shrinking, and growth is entirely dependent on new business filling the hole. Many unprofitable SaaS companies that eventually collapsed had NRR below 100% masked by aggressive new customer acquisition.
Rule of 40: Balancing Growth and Profitability
The Rule of 40 states that a healthy software company's revenue growth rate plus its free cash flow margin should exceed 40%. A company growing 50% with negative 5% FCF margin scores 45, which is solid. A company growing 10% with 15% FCF margin scores 25, which is not.
This metric works because it penalizes companies that sacrifice all profitability for growth and equally penalizes mature companies that have stopped growing but are not returning capital. The best tech businesses eventually score well above 40 from both sides: Microsoft, for instance, combines mid-teens growth with 30%+ FCF margins for a Rule of 40 score near 50.
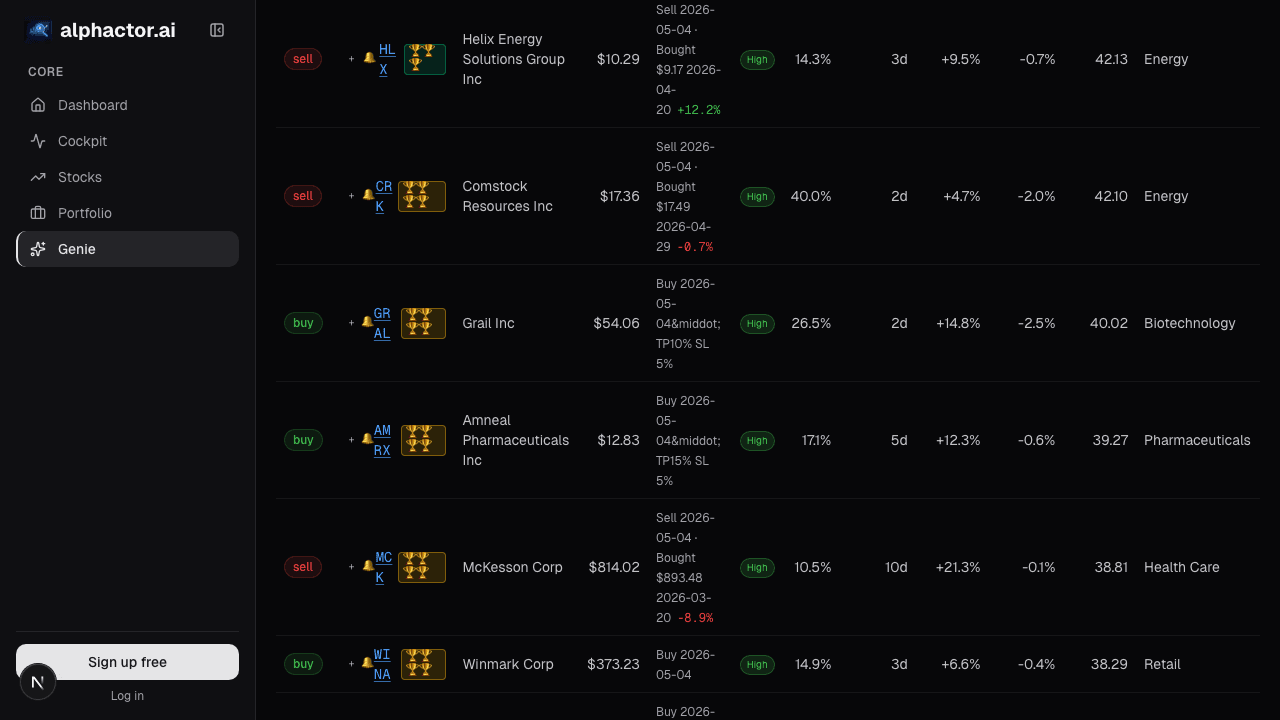
Use the Alphactor universe scanner to filter for technology companies above the Rule of 40 threshold. The resulting list skews heavily toward quality.
Free Cash Flow Over Earnings
In technology, GAAP earnings are nearly useless as a primary metric. Stock-based compensation, which is excluded from non-GAAP earnings but very much a real cost, routinely represents 20-40% of revenue at growth-stage tech companies. Snap's SBC has exceeded 25% of revenue for most of its public life.
Free cash flow captures actual cash generation after all operating expenses and capital expenditures. It is the number that funds buybacks, pays down debt, and eventually determines whether the company can sustain itself without external capital. A tech company with negative free cash flow is burning runway, regardless of what the adjusted earnings press release says.
Capital Intensity Matters More Than You Think
The market treats "tech" as a monolith, but the capital requirements vary enormously. A cloud software company might spend 5-8% of revenue on capex. A semiconductor manufacturer like TSMC spends north of 40%. A hyperscaler like Amazon or Google is somewhere in between, pouring tens of billions annually into data centers.
Higher capital intensity compresses free cash flow margins and increases cyclical risk. It also creates barriers to entry, which is why TSMC commands the margins it does. The analysis depends on whether you view capex as offensive (growth investment) or defensive (maintenance spending). For each tech sub-sector, understanding where capital goes is essential to understanding the return profile.
Putting It Together
A disciplined tech analysis framework looks at five layers: gross margin (business model quality), NRR or equivalent retention metric (growth durability), Rule of 40 (growth-profitability balance), free cash flow (real economics), and capital intensity (sustainability and risk). Revenue growth matters, but only in the context of these supporting metrics.
The stocks that score well across all five dimensions, companies like Microsoft, ASML, and Intuit, tend to compound quietly while the market chases the latest revenue growth story. Use Alphactor's Alphactor charts to spot which tech sub-sectors are attracting capital, then drill into fundamentals to separate the compounders from the combustibles.
FAQ
What is the first metric I should check on a tech stock?
Start with gross margin because it tells you what kind of business model you are underwriting. A high-margin software company, a semiconductor capital equipment company, and a consumer hardware company can all be "tech," but their economics are not interchangeable.
Is revenue growth still important for mature tech companies?
Yes, but it matters less on its own. For mature platforms, I care more about whether revenue growth is paired with operating leverage, free cash flow, and a believable reinvestment runway.
How should I compare SaaS and hardware stocks?
Do not compare them on revenue growth alone. SaaS needs retention, gross margin, and Rule of 40 discipline; hardware and semiconductor names need capex intensity, inventory cycles, and unit-demand durability.
When is a high-growth tech stock too risky?
The risk usually becomes obvious when growth depends on heavy sales spend, free cash flow stays negative, retention weakens, or capital needs rise just as the multiple is compressing.
Related posts
See it in the app
Live dashboard views that match this post. Each tile deep-links to the exact card.

Stocks mentioned
Related reading
Price-to-Book Value: Useful for Banks, Misleading for Tech
Price-to-book works for banks and asset-heavy industrials but misleads for software. Here is how to apply it correctly by sector and when to skip it.
Consumer Staples as Portfolio Defense
Why consumer staples outperform during downturns, which metrics define quality in the sector, and how to use boring stocks as portfolio insurance.
Energy Stocks and the Commodity Cycle
How commodity price cycles drive energy stock returns, and a framework for timing entries and exits across upstream, midstream, and downstream companies.
Bank Stocks and Interest Rates
Why the simplistic 'higher rates help banks' narrative breaks down, and how to analyze financial stocks through net interest margin, credit quality, and the…
Healthcare Investing: Pharma, Biotech, and the FDA Calendar
A framework for navigating healthcare stocks across pharma, biotech, and medical devices, with emphasis on regulatory catalysts and pipeline valuation.
How to Compare Two Stocks Side by Side (The Right Way)
A step-by-step guide to using Alphactor's comparison tools to evaluate two stocks across fundamentals, technicals, and alternative data.
Ready to try alphactor.ai?
Validate your trading strategies with statistical credibility testing. Start free.
Get Started Free