How to Compare Two Stocks Side by Side (The Right Way)
A step-by-step guide to using Alphactor's comparison tools to evaluate two stocks across fundamentals, technicals, and alternative data.
 Marcus Chen4 min read
Why Direct Comparison Beats Isolated Analysis
Analyzing a stock in isolation tells you whether it looks good on paper. Comparing it to a peer tells you whether it looks good relative to the alternatives. And relative is what matters when you are deciding where to allocate capital.
Most investors compare stocks by opening two tabs and flipping back and forth. That works until you need to compare margins, growth rates, valuation multiples, and technical signals simultaneously. The stock comparison view puts two stocks side by side with aligned metrics so you can spot differences immediately.
Step 1: Open the Comparison View
There are two ways to start a comparison:
From any stock detail page: click the Compare button in the top toolbar (or go directly to the stock comparison page).
This opens a search field where you type the second ticker. The comparison view loads with both stocks displayed in parallel columns.
From the screener results: select two stocks using the checkboxes, then click Compare Selected from the action menu. This is useful when your screen has returned multiple candidates and you want to evaluate the top two head to head.
Step 2: Compare Fundamentals First
The comparison view organizes data into sections. Start with Fundamentals:
- Valuation: P/E, P/S, P/FCF, EV/EBITDA -- compared against each other and their respective sector medians
- Growth: Revenue growth, earnings growth, and free cash flow growth over 1-year and 3-year periods
- Profitability: Gross margin, operating margin, net margin, and return on equity
- Balance sheet: Debt-to-equity, current ratio, and interest coverage
Look for asymmetries. If Stock A trades at a lower P/E than Stock B but has faster revenue growth and higher margins, that is worth investigating. If Stock B's valuation premium is justified by meaningfully better profitability, the comparison makes that visible.
Step 3: Compare Technical Profiles
Scroll to the Technical section to see price performance and momentum indicators side by side:
- Price performance: 1-month, 3-month, 6-month, and 1-year returns
- Relative strength: how each stock has performed versus the S&P 500
- Volatility: average daily range and beta
- Moving averages: position relative to 50-day and 200-day moving averages
This section answers: "Which stock has better price momentum, and how much more volatile is one versus the other?" If both stocks have similar fundamentals but one is in a clear uptrend while the other is basing, that timing difference may influence your entry decision.
Step 4: Compare Alternative Data
The Alternative Data section shows:
- Conviction score: the overall AI score and its breakdown by signal category
- Institutional activity: whether 13F filings show accumulation or distribution
- Congressional trades: any recent lawmaker transactions
- Insider activity: recent insider buys or sells
Alternative data adds a layer that pure financial analysis misses. If institutional investors are accumulating Stock A while trimming Stock B, and both look similar on fundamentals, the smart-money flow provides a tiebreaker.
Step 5: Compare Risk Profiles
The Risk section shows:
- Beta: sensitivity to market movements
- Maximum drawdown: the largest peak-to-trough decline over the past year
- Correlation to S&P 500: how closely the stock tracks the broader market
- Sector concentration risk: whether the stock adds diversification to your portfolio or duplicates existing exposure

If you already hold several high-beta growth stocks, choosing the lower-beta option between two similar candidates might improve your portfolio's overall risk profile even if the expected return is marginally lower.
Step 6: Make the Decision Framework Explicit
Before you finish the comparison, write down the three criteria that matter most for this specific decision. Then score each stock on those criteria.
For example, if you are choosing between two SaaS companies for a growth allocation:
| Criteria | Stock A | Stock B |
|---|---|---|
| Revenue growth rate | 28% | 19% |
| Free cash flow positive | No | Yes |
| Conviction score | 72 | 68 |
Different investors will weight these criteria differently. The point is not to find an objectively "better" stock but to make your reasoning explicit so you can revisit the decision later and understand why you chose what you chose.
Common Comparison Mistakes
Comparing across sectors. A SaaS company and a bank will have different margin profiles, growth rates, and valuation norms. Cross-sector comparisons are valid but require adjusting expectations. Use sector-relative metrics when available.
Anchoring on one metric. If you only compare P/E ratios, you will miss that the cheaper stock has declining revenue and the more expensive one is growing at 30%. Use the full comparison view, not a single number.
Ignoring your portfolio context. The better stock on paper might be worse for your portfolio if it duplicates an exposure you already have. Check the risk section for correlation with your existing holdings.
When to Use Comparison
Use the stock comparison view whenever you are choosing between two candidates for the same portfolio slot, deciding whether to swap an existing position for a better alternative, or validating that your current holding still compares favorably against its closest peer. It takes five minutes and consistently surfaces insights that isolated analysis misses.
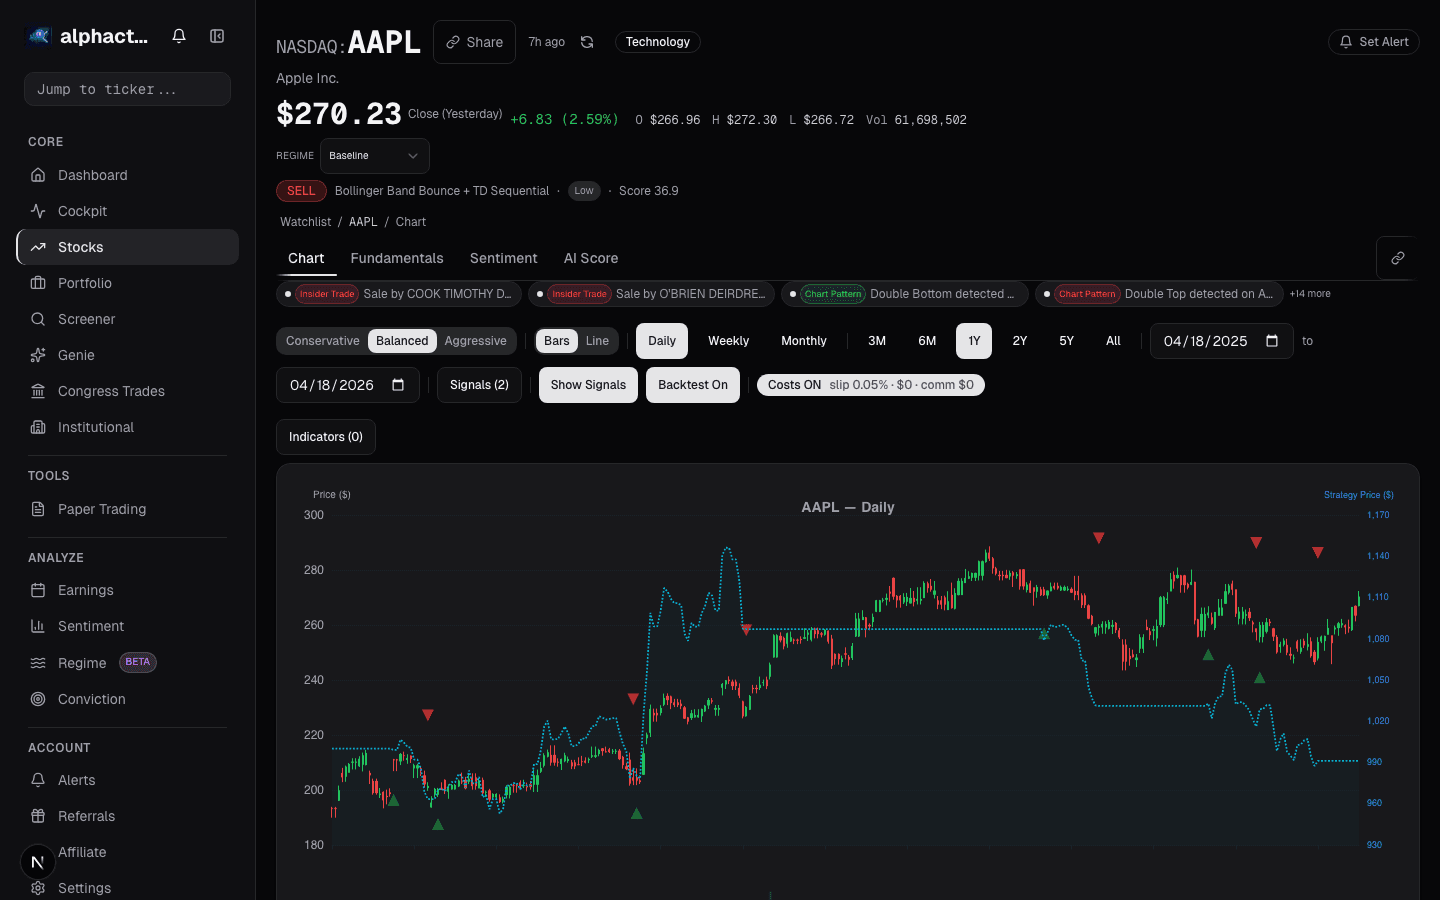
See it in the app
Live dashboard views that match this post. Each tile deep-links to the exact card.


Stocks mentioned
Related reading
How to Analyze Tech Stocks
The financial metrics that separate winning tech investments from hype-driven traps, with frameworks for evaluating SaaS, hardware, and platform businesses.
The 10-Minute Daily Stock Research Workflow
A structured daily routine for checking your portfolio, reviewing signals, and identifying new opportunities in under ten minutes.
Free vs Pro: Which Plan Fits Your Trading Style?
A practical comparison of Alphactor's Free, Pro, and Premium plans to help you pick the right tier for your trading and analysis workflow.
What Is a Stock Universe and How Smart Investors Use One
How defining a stock universe sharpens your research process, reduces noise, and helps you focus on opportunities that match your strategy.
TradingView vs alphactor.ai
TradingView leads for charting and Pine Script. Alphactor adds an 8-layer credibility pipeline with walk-forward validation and Deflated Sharpe Ratio testing.
Ready to try alphactor.ai?
Validate your trading strategies with statistical credibility testing. Start free.
Get Started Free