Energy Stocks and the Commodity Cycle
How commodity price cycles drive energy stock returns, and a framework for timing entries and exits across upstream, midstream, and downstream companies.
 Marcus Chen4 min read
Energy Is a Commodity Business First
Every other factor in energy investing, management quality, balance sheet strength, reserve life, operational efficiency, is secondary to the price of the underlying commodity. When crude oil goes from $40 to $80, nearly every upstream company doubles in value. When it reverses, nearly every upstream company gets cut in half. The tide lifts and sinks all boats, and the tide is commodity price.
This makes energy fundamentally different from sectors like technology or healthcare, where company-specific factors dominate. In energy, macro positioning matters more than stock picking. Getting the cycle right accounts for the majority of returns.
Understanding the Three Sub-Sectors
Upstream companies (ConocoPhillips, Devon Energy, Pioneer/now ExxonMobil's Permian unit) explore for and produce oil and gas. Their revenues are directly tied to commodity prices and production volumes. Upstream is the highest-beta play on energy prices.
Midstream companies (Enterprise Products Partners, Williams Companies, Kinder Morgan) transport, store, and process hydrocarbons through pipelines and facilities. Most midstream revenue comes from long-term fee-based contracts with volume commitments, making cash flows more predictable regardless of commodity prices. Midstream is the income play.
Downstream companies (Valero, Marathon Petroleum, Phillips 66) refine crude oil into gasoline, diesel, and jet fuel. Their profitability depends on crack spreads, the difference between crude oil input costs and refined product prices, rather than absolute commodity levels. A refiner can profit in a low oil price environment if crack spreads are wide.
Each sub-sector responds differently to the commodity cycle. Upstream surges during price rallies and crashes during busts. Midstream is more stable but still exposed to volume declines in prolonged downturns. Downstream can actually benefit from falling crude prices if product demand holds up, widening crack spreads.
Reading the Commodity Cycle
Oil prices are cyclical because of the lag between price signals and supply response. When prices rise, producers invest in new drilling. New supply takes 12-24 months to come online. By the time it arrives, demand may have softened or other producers have also ramped up, creating oversupply. Prices fall, capex gets cut, supply eventually tightens, and the cycle repeats.
The key indicators to watch:
Rig count. Baker Hughes publishes weekly US rig counts. Rising rig counts signal increasing supply that will eventually pressure prices. Falling rig counts signal the opposite.
OPEC+ policy. The cartel still controls enough marginal supply to influence prices. Production cuts tighten markets; quota increases loosen them. Pay attention to compliance rates, not just announced quotas.

Inventory levels. The EIA's weekly petroleum status report shows US crude and product inventories. Draws (declining inventory) are bullish; builds are bearish. The five-year average provides context for whether current levels are tight or comfortable.
Demand signals. Refinery utilization rates, gasoline demand, and jet fuel consumption indicate real economic activity. A supply deficit matters only if demand holds.
When to Buy Energy Stocks
The best entries in energy come when three conditions align: commodity prices are below the cost of marginal production (roughly $50-55 per barrel for US shale), capital spending has been slashed for at least two consecutive quarters, and balance sheets have been repaired through asset sales or debt reduction.
This combination existed in late 2020 and early 2021, after COVID crushed demand and oil briefly went negative. Investors who bought upstream names at that point captured 200-400% returns over the following two years.
The worst time to buy is when prices are at cycle highs, producers are generating record free cash flow, and Wall Street is upgrading the sector after the move has already happened. That was the energy trade in mid-2022, right before crude rolled over from $120 to $70.
Alphactor's universe scanner can filter energy companies by free cash flow yield, debt-to-equity, and dividend yield, which helps surface names with balance sheet strength to survive downturns and participate in recoveries.
The Capital Discipline Revolution
The 2020 crash forced a structural shift in how US producers allocate capital. After a decade of spending every dollar of cash flow (and more) on drilling, the industry adopted a discipline framework: return 50-75% of free cash flow to shareholders through dividends and buybacks, reinvest only enough to maintain or modestly grow production.
This has compressed the supply response to higher prices, which is structurally bullish for the cycle. Companies like Pioneer (before its ExxonMobil acquisition), Devon Energy, and Diamondback Energy led this shift and were rewarded with multiple expansion.
For investors, this means the current energy cycle may behave differently than previous ones. Less aggressive reinvestment means slower supply growth, which means higher prices persist longer, but also means less production upside when prices spike.
Portfolio Positioning
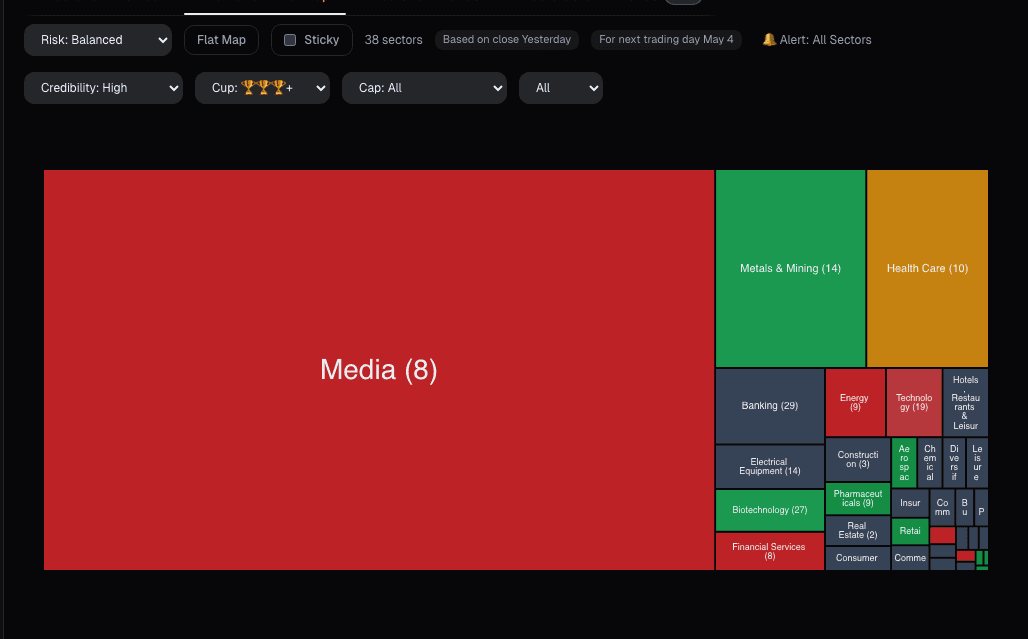
Energy deserves a permanent allocation for most investors, typically 5-10% of equities. The sector provides inflation protection, portfolio diversification (low correlation with tech-heavy indices), and income through dividends. Use the Alphactor charts to track relative performance versus other sectors. When energy is deeply out of favor and the heatmap shows persistent red, start building positions. When it is leading all sectors after a sustained rally, trim.
The commodity cycle has not been repealed. It has only been modified. Understanding its rhythms remains the most valuable edge in energy investing.
See it in the app
Live dashboard views that match this post. Each tile deep-links to the exact card.
Stocks mentioned
Related reading
How to Analyze Tech Stocks
The financial metrics that separate winning tech investments from hype-driven traps, with frameworks for evaluating SaaS, hardware, and platform businesses.
Defense Stocks: Government Contracts as a Revenue Moat
How defense contractors generate durable revenue through government contracts, and the metrics that matter for analyzing Lockheed Martin, RTX, and their peers.
Industrial Stocks: Betting on the Real Economy
How industrial stocks track economic growth, the leading indicators that predict their performance, and a framework for investing across the industrial…
Semiconductor Stocks: Cyclical, Essential
How to invest in semiconductor stocks by understanding the chip cycle, supply chain structure, and competitive moats that define the industry.
Utility Stocks for Income: Yield, Safety
How to evaluate utility stocks for income portfolios, including the regulatory framework, rate sensitivity dynamics, and metrics that identify quality…
Ready to try alphactor.ai?
Validate your trading strategies with statistical credibility testing. Start free.
Get Started Free