Part of: Fundamental Analysis
Income Statement Deep Dive
Press releases report two numbers. The full P&L is where you find restructuring charges pushed below the line, segment reclassifications that change…
 Sarah Patel7 min read
In Q3 2019 a mid-cap software company I was reviewing reported what looked like a clean beat, non-GAAP EPS above consensus, revenue in-line. Press-release view said "solid quarter." The full income statement told a different story. R&D as a share of revenue had dropped 240 bps YoY, S&M had dropped 180 bps, and the whole "non-GAAP" reconciliation was inflated by a restructuring charge that represented 17% of GAAP operating expenses pushed below the operating-income line. The "beat" was entirely engineered by aggressive classification of ongoing spend as one-time. Stock sold off 9% within two sessions when a single analyst published a note pointing out the R&D decline; I'd seen the pattern a week earlier just reading the statement line-by-line. The press-release summary was a product release. The full statement was the actual business. Skipping from the release to the non-GAAP table without reading the underlying lines is the single most common mistake retail investors make with quarterly data, the reconciliation is where management's judgment lives, and judgment can be flattering.
This post is about the Income Statement card, the five rows that reward the most attention, and the three common adjustments that signal earnings-quality deterioration before it shows up in the price.
TL;DR
- The press release is a marketing document. The full statement is where you find the actual business story.
- R&D and S&M trends are the growth-hedge readout. A drop in either without revenue deceleration is pull-forward.
- Stock-based comp growing faster than revenue is dilution eating growth.
- Restructuring / Other Operating Expense lines usually contain one-time items that make non-GAAP reconciliations look generous.
- Tax rate swings > 3 pts YoY distort EPS: always read the tax footnote before comparing headline EPS YoY.
Beyond the press-release view
Earnings press releases report two numbers: EPS and revenue, with a growth percentage and a carefully-worded narrative. That's the top half of a single slide. The full income statement, line-by-line, quarter-by-quarter, with the footnotes, is where you find the differences between "the business" and "the release."
Common differences management teams understate in press releases but the statement reveals:
- Restructuring charges pushed below the operating-income line, so non-GAAP operating income looks better than underlying
- Segment reclassifications that change how growth is attributed (a slowing segment gets folded into a faster one)
- Stock-based compensation removed from non-GAAP earnings but very much real as shareholder dilution
- Impairment charges on goodwill or intangibles that signal a prior acquisition is being walked back
- Tax rate one-offs (credits, deferred tax reversals, repatriation adjustments) that flatter or punish YoY EPS without reflecting underlying profitability
Investing on the press release summary leaves all of this on the table. The statement is about 10 minutes of reading per name, quarterly. The cost of skipping it is the difference between reported and real earnings quality, which can be very large.
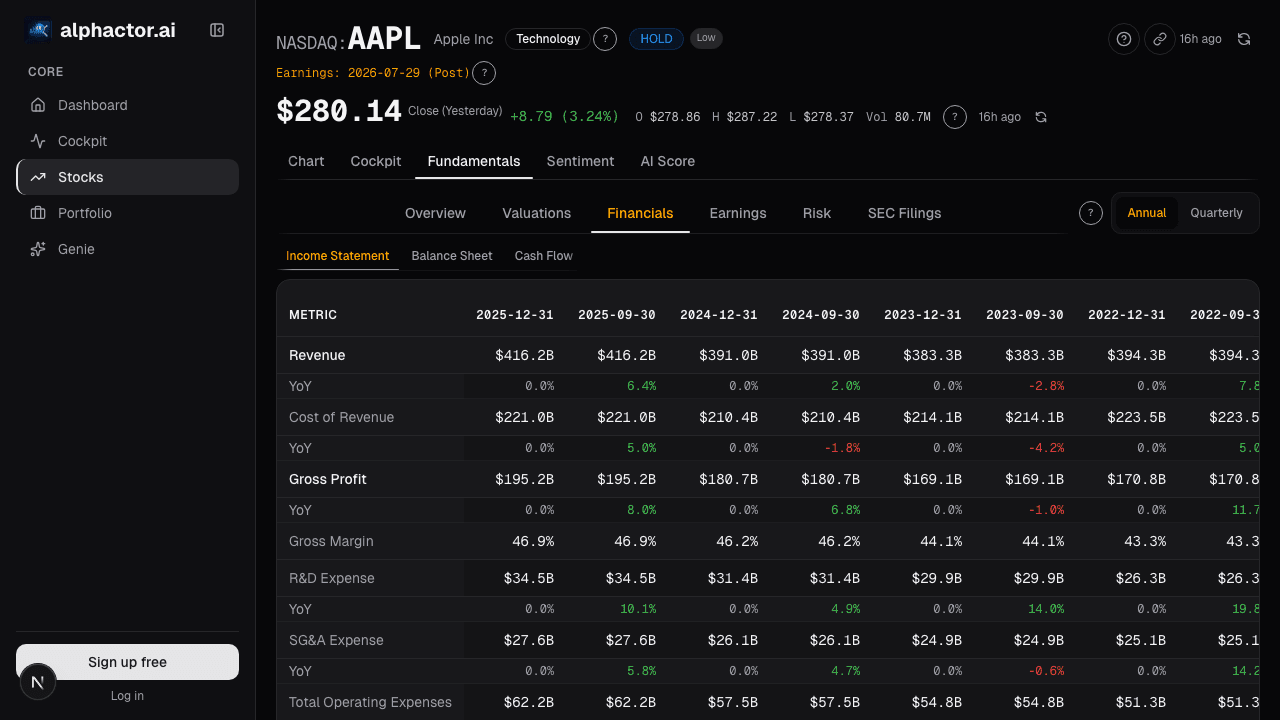
What the Income Statement card shows
The Income Statement card presents the full quarterly (or annual) P&L for up to 20 periods:
- Every GAAP line with the current and prior period and QoQ / YoY deltas
- Common non-GAAP reconciliations (adjusted operating income, adjusted net income, adjusted EPS) with management's own reconciliation tables linked
- "% of revenue" toggle: converts the table to common-size so margin mix comparison across periods doesn't require arithmetic
- Segment-level revenue and profit below the consolidated view when segments are reported
- One-time item flags: restructuring charges, impairments, gains/losses on sales, litigation settlements, with per-period totals so you can see the pattern
- Trailing 8-quarter chart for any selected line, so trend is visible without leaving the table
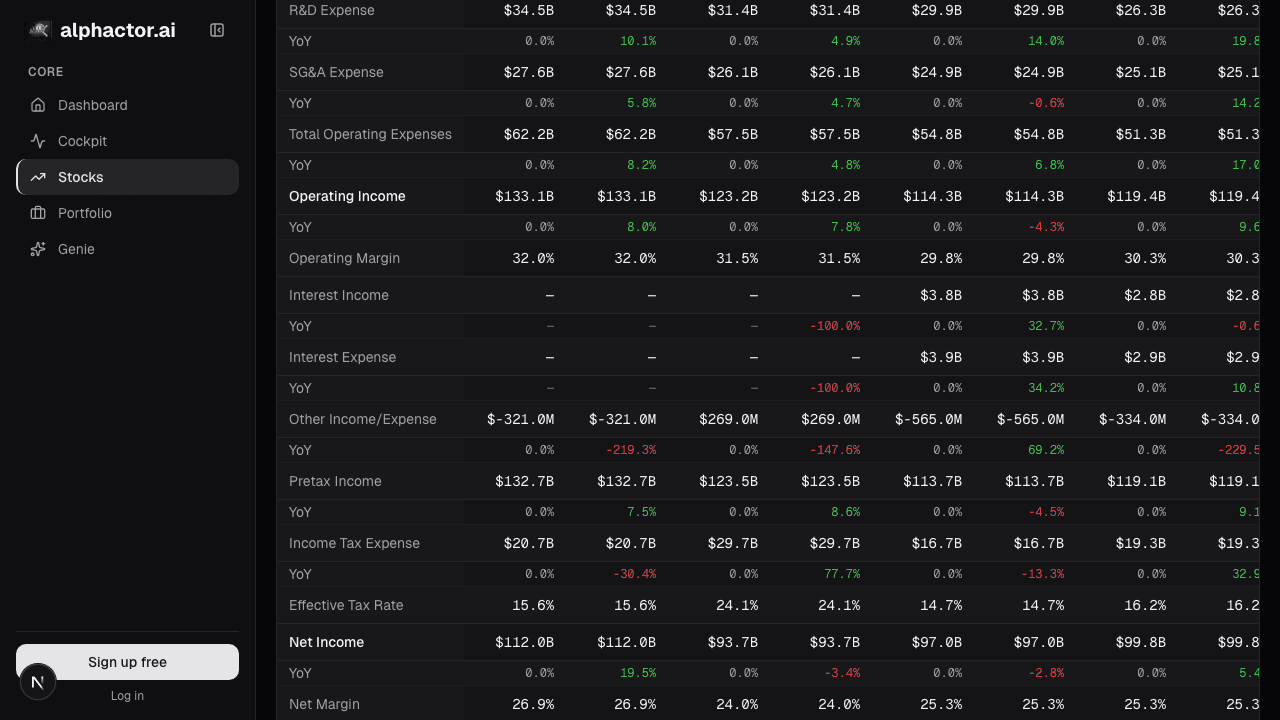
Five rows that reward attention
R&D as % of revenue, trended. Rising for a growth name = reinvestment (good). Falling for a mature name = harvest mode (can be good). Falling for a growth name without revenue reacceleration = worrying, they're under-investing to hit near-term numbers. A drop of 150+ bps YoY with flat or decelerating top-line growth is a clear yellow flag.
S&M as % of revenue. A sudden drop in S&M without a revenue deceleration is often pull-forward, the company is letting the sales pipeline thin out to save money this quarter at the cost of future quarters. Watch for this especially in enterprise software where S&M leads revenue by 2-4 quarters.
Stock-based comp trend. Growing faster than revenue means dilution is outpacing growth, the value per share is getting worse even as the top-line expands. SBC growing slower than revenue is the inverse and is healthy.
Other Operating Expense / Restructuring. Big lines below the core almost always contain one-time items that matter for the non-GAAP reconciliation. Read the footnotes; if the same "one-time" charge has appeared for 3+ quarters, it isn't one-time.
Tax rate. A tax rate swing of > 3 pts vs. the prior year is worth reading the 10-Q footnote, one-off credits, changes in valuation allowances, and jurisdictional mix shifts distort YoY EPS comparisons and tell you nothing about underlying profitability.
Example: the Q3 2019 software beat that wasn't
Common-size view of the quarter I referenced in the intro:
| Line | Q3 2019 | Q3 2018 | YoY delta |
|---|---|---|---|
| Revenue | 100% | 100% | , |
| R&D | 17.4% | 19.8% | -240 bps |
| S&M | 42.1% | 43.9% | -180 bps |
| G&A | 10.2% | 10.0% | +20 bps |
| Restructuring (below OpInc) | 6.8% | 0.5% | +630 bps |
| GAAP operating margin | 10.3% | 9.8% | +50 bps |
| Non-GAAP operating margin | 17.1% | 10.3% | +680 bps |
| SBC as % of revenue | 14.5% | 11.2% | +330 bps |
The non-GAAP margin expansion of 680 bps looks impressive. Where did it come from? 630 bps from reclassifying ongoing operating spend as "restructuring" and pushing it below the operating-income line. The R&D and S&M drops (-240 + -180 = 420 bps) also flattered non-GAAP operating margin. Underlying, the business wasn't expanding margins; management was reclassifying costs to show margin expansion. The stock sold off when a single analyst wrote the note explaining this; the full statement had the story a week earlier.
What the statement can't tell you
- Forward guidance. The statement is backward-looking. Forward views require the call transcript, management guide, and consensus estimates.
- Cash conversion. The income statement is accrual-based; cash conversion requires the cash flow statement. High earnings with low cash conversion is an accruals-quality issue.
- Segment profitability at the product level. Segments are management-defined and can be reorganized; inter-segment comparison over time requires care.
- Unit economics. Revenue, COGS, and gross margin aggregate unit economics; the per-customer or per-product view requires management commentary or channel checks.
Common mistakes
- Reading only non-GAAP. Non-GAAP is management-defined; they flatter their own numbers. Always compare GAAP and non-GAAP side by side.
- Accepting "one-time" labels without checking history. If a charge has appeared for 3+ quarters, it's recurring regardless of what management calls it.
- Ignoring stock-based comp. SBC is a real cost to shareholders; removing it from earnings doesn't make the dilution disappear.
- Comparing raw dollar growth in opex without common-size. A 12% opex increase on 15% revenue growth is leverage. A 12% increase on 4% revenue growth is decay. Common-size exposes the difference.
- Skipping segment view. Consolidated growth can mask a decelerating core segment that's being carried by a smaller but faster-growing one.
Where it fits
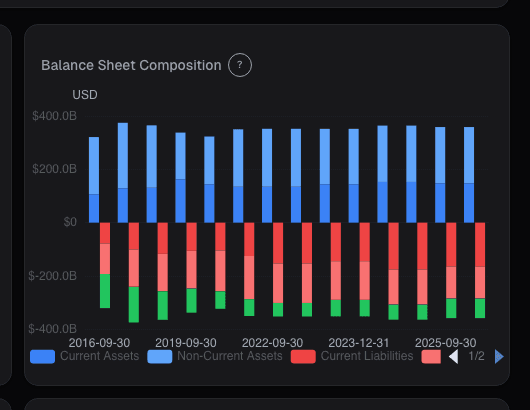
Combine the statement with the Income Waterfall for the same period's visual shape, Earnings Quality for cash-backing context (earnings with low OCF-to-NI ratio are lower-quality), and Earnings History for the beat/miss pattern against consensus. For balance-sheet context on whether margin expansion is coming with leverage growth, cross to Balance Sheet and Cash Flow.
FAQ
How do I know if a non-GAAP adjustment is reasonable?
Read the company's own reconciliation in the 10-Q. Reasonable adjustments: genuinely one-time M&A costs, acquisition-related intangible amortization (debatable), discrete legal settlements. Unreasonable: recurring restructuring, ongoing cost reclassifications, stock-based comp removal.
How often does the card update?
Within hours of each 10-Q / 10-K filing. Press-release numbers are placeholder until the filing lands; the card flags pre-filing values.
Can I export the statement to a model?
Yes, CSV and XLSX exports with full line-item history. Useful for pulling into your own DCF.
What about non-US filers?
Supported where IFRS financials are available. Some line items differ between IFRS and GAAP (e.g., operating income definition); the card labels the reporting standard.
Is segment data always reliable?
Management-defined segments can be reorganized. When a company restates segments, the card shows both the new and old segmentation during the transition quarter.
Related reading
- Income Waterfall, Margin Bridge
- Accruals Quality, Earnings Manipulation
- Altman Z, Bankruptcy Risk
- Balance Sheet, Capital Structure
Open the Income Statement → /app/stocks/AAPL/fundamentals
See it in the app
Live dashboard views that match this post. Each tile deep-links to the exact card.

Stocks mentioned
Related reading
Accruals Quality: How to Spot Earnings That Aren't Real
Accruals measure the gap between reported earnings and actual cash. Widening accruals is one of the most reliable red flags in financial analysis, Sloan's…
Altman Z-Score: A Bankruptcy Predictor That Still Works
Edward Altman's 1968 discriminant model predicts bankruptcy within two years about 72% of the time at its distress threshold.
Balance Sheet Deep Dive
Balance sheet changes lead income statements by 2-6 quarters. Net debt, receivables days, and goodwill are the lines that move stocks first.
Price-to-Book Value: Useful for Banks, Misleading for Tech
Price-to-book works for banks and asset-heavy industrials but misleads for software. Here is how to apply it correctly by sector and when to skip it.
Income Statement Waterfall
A waterfall chart makes margin composition visible at a glance. How to separate durable margin expansion from a pull-forward that breaks within 18 months.
Ready to try alphactor.ai?
Validate your trading strategies with statistical credibility testing. Start free.
Get Started Free