Part of: Earnings Analysis
CME Group's 8-K Is Not a Press Release: How to Read an Item 2.02 Filing
An SEC 8-K under Item 2.02 contains primary earnings data, not a press release. CME's filing pattern makes it especially useful for rate-regime traders.
 Marcus Chen8 min read
Most investors treat an 8-K filing the same way they treat a press release, skim the headline number, check if it beat or missed, move on. For something like CME Group's quarterly earnings 8-K, that approach leaves an enormous amount of primary information on the table.
An Item 2.02 8-K isn't a press release with a legal wrapper around it. It's a structured primary disclosure that links directly to financial exhibits. If you know what you're looking at, it tells you things the headline number doesn't.
TL;DR
- An 8-K filed under Item 2.02 ("Results of Operations and Financial Condition") is primary SEC disclosure, not a marketing document.
- The financial exhibit attached to the 8-K contains actual income statement data, often before a formal 10-Q is filed.
- CME Group is an exchange operator, its revenue is structurally tied to trading volumes across rates, equities, energy, and agricultural futures. This makes its 8-K especially informative for macro-regime analysis.
- Reading the exhibit, not just the headline, reveals which product lines drove results, a dimension the press release summary often glosses over.
- Counter the common misconception: the 8-K and the attached exhibit are legally distinct from the press release, even when issued simultaneously.
What Item 2.02 Actually Is
The SEC's Form 8-K requires public companies to disclose material events on a timely basis. Item 2.02 specifically covers "Results of Operations and Financial Condition", meaning companies must file an 8-K when they publicly announce quarterly or annual financial results. The filing deadline is four business days after the announcement.
Here's the detail that most retail investors miss: Item 2.02 doesn't require financial statements in the body of the 8-K itself. It requires the company to furnish a press release or other document that discloses the results. That document becomes Exhibit 99.1 to the 8-K, attached and accessible via SEC EDGAR primary sources. When you read the 8-K, you're reading the legal cover sheet. When you read Exhibit 99.1, you're reading the actual financial data.
The distinction matters because the body of the 8-K often says something minimal, "On [date], the Company issued a press release regarding financial results for the quarter ended [date]. A copy of the press release is furnished as Exhibit 99.1." That's the entire substantive content of many 8-Ks. The real document is the exhibit.
The Counter-Argument: Isn't the 8-K Just a Press Release by Another Name?
This is the most common misconception, and it's worth addressing directly. Many companies do issue the earnings press release and simultaneously attach it to an 8-K. They're using the same document for two purposes. So in practice, the press release and Exhibit 99.1 are often identical.
But they're not legally identical. A press release on the company's investor relations website is not filed with the SEC. An Item 2.02 8-K is. The 8-K creates a formal record in EDGAR that is timestamped, searchable, and legally subject to securities disclosure obligations. Materially false statements in a press release are still subject to securities law, but the 8-K is the official submission.
More practically: companies sometimes file a preliminary 8-K with partial results before the full press release goes out, or file exhibits that contain more detailed data tables than what appears on the IR page. EDGAR is the authoritative source, not the company's own website. If there's ever a discrepancy between what's on EDGAR and what the company's PR team has published, EDGAR governs.
Why CME's Filing Pattern Is Especially Informative
CME Group operates the world's largest derivatives exchange complex, running markets for interest-rate futures (Treasuries, SOFR, Eurodollar history), equity index futures (S&P 500, Nasdaq, Dow), energy futures (WTI crude, natural gas), agricultural futures (corn, soybeans, wheat), metals, and foreign exchange. This makes CME's revenue essentially a report on trading activity across the full global macro complex.
When CME's earnings analysis 8-K drops, you can parse Exhibit 99.1 for product-line volume data that tells you something the headline revenue figure doesn't. Interest-rate product volumes reflect the market's need to hedge rate risk, which is directly correlated to rate volatility. When the Fed is in an active hiking or cutting cycle, CME's rate-product volumes tend to expand. When the Fed is on hold and rate volatility is suppressed, they compress.
This means reading CME's 8-K quarterly is one of the cleanest primary-source reads on where institutional hedging demand is concentrated. A quarter where rates-product volumes grew significantly while equity-index volumes were flat tells you something about where the macro fear was: rate risk, not equity risk. That's actionable context for constructing your own macro-regime view.
Equity traders who don't normally follow CME should consider looking at these filings because they're essentially a market-structure X-ray. You're seeing which derivative markets had the highest transactional demand, and that's a proxy for where the most uncertainty existed. If you want to see how CME's own price is reacting to the release in real time, the CME overview card and the live signal feed for $CME are where I start, the signal stream surfaces volume spikes and sentiment shifts as they print, not hours later in a recap.
Reading the Exhibit: What to Actually Pull
When you open CME's Exhibit 99.1, here's the reading order that extracts the most signal efficiently.
Average daily volume (ADV) by product line. CME reports ADV for each product complex. This is the first number to check, because CME's pricing is largely volume-driven. The headline revenue figure is a lagging outcome of the ADV; the ADV shows you the mechanical driver.
Revenue per contract (RPC). CME reports revenue per contract alongside ADV. RPC can shift quarter to quarter based on product mix, some contracts (e.g., options on futures) carry higher fees than standard futures. If ADV is flat but revenue grew, RPC likely improved, which means the mix shifted toward higher-fee products. That's a different business story than a pure volume increase.
Interest income from collateral. CME holds substantial customer margin deposits. Because this income stream is essentially a fixed-income carry trade, it has a beta near zero to equity markets but meaningful sensitivity to short-term rate levels. In higher-rate environments, the interest earned on these deposits is a meaningful revenue stream. This line can be large or small depending entirely on the interest-rate regime. It's not operating performance, it's a rate-beta embedded in CME's financials. Investors who don't read this line can misattribute rate-income gains as operating leverage when they're actually passive carry.
Expenses. CME's cost structure is relatively fixed. Technology infrastructure, compensation, and regulatory compliance don't scale linearly with volume. This creates significant operating leverage: volume increases flow heavily to the bottom line once fixed costs are covered. Reading the expense section tells you whether any cost surprises (technology investments, legal settlements) are distorting the underlying earnings power.
Connecting CME's Results to Broader Regime Context
A sophisticated use of CME's quarterly data is triangulating it against the macro-regime picture you already have. If you're tracking rate-volatility regime through SEC EDGAR primary sources and other data, CME's ADV for Treasury and SOFR products provides an independent confirmation of whether the rate hedging demand you expected is actually showing up in market structure.
For instance: if the Fed has been making frequent, unpredictable policy communications and you expect this to elevate rate vol, CME's next 8-K will either confirm (high rates-product ADV) or challenge (unexpectedly low ADV, suggesting the market absorbed the uncertainty differently than you expected) that thesis. The 8-K becomes a calibration tool, not just an earnings event.
Rate-regime traders who don't look at exchange-operator earnings are missing a primary-data source that's remarkably clean, exchange volume data is hard to manipulate, unlike earnings estimates or management commentary. The macro regime dashboard is where I keep this triangulation running between prints, and the CME fundamentals view lines up the segment revenue against the ADV commentary so you don't have to flip tabs.
FAQ
How is an Item 2.02 8-K different from a 10-Q?
A 10-Q contains full audited financial statements with footnotes and management's discussion and analysis, filed quarterly within 40–45 days of quarter end. An Item 2.02 8-K is a preliminary earnings announcement, typically filed within four business days of the announcement date, containing a press release or earnings release as an exhibit. The 8-K comes first; the 10-Q with full detail comes later. Never assume the 8-K exhibit contains everything the 10-Q will.
Where exactly do I find the exhibit on EDGAR?
Search for the company's ticker on SEC EDGAR, navigate to Form 8-K filings, open the filing, and scroll to the "Documents" section. Exhibit 99.1 is typically listed directly in the filing's document table. Click it to open the financial exhibit. Most earnings releases are HTML or PDF documents embedded in the filing.
Can CME's ADV data be used to anticipate the next quarter?
Partially. CME reports weekly and monthly ADV figures in press releases between quarters, so the quarterly 8-K doesn't always contain new volume information if you've been tracking the monthly releases. The quarterly 8-K is still valuable for the full revenue/expense picture and the management commentary in the earnings call that accompanies it.
Does CME's earnings data affect other exchange stocks?
Yes, it tends to. CME Group's results set a tone for exchange-sector peers like Intercontinental Exchange (ICE), Cboe Global Markets, and Nasdaq. Strong CME results in rate-product volumes often lead to positive revisions for ICE (which runs energy and credit default swap markets). These are not identical businesses, but sector contagion from a bellwether's 8-K is worth tracking.
How do I know if CME's results are being distorted by one-time items?
Read past the headline and look for charges or gains labeled as non-recurring: legal settlements, restructuring charges, technology write-downs. CME's press release exhibit will typically present both GAAP and adjusted (non-GAAP) earnings. The adjustment table shows exactly what's being excluded. If a quarter's GAAP earnings look unusual, the adjustment table will tell you whether it's a real business shift or a one-time item.
Related posts
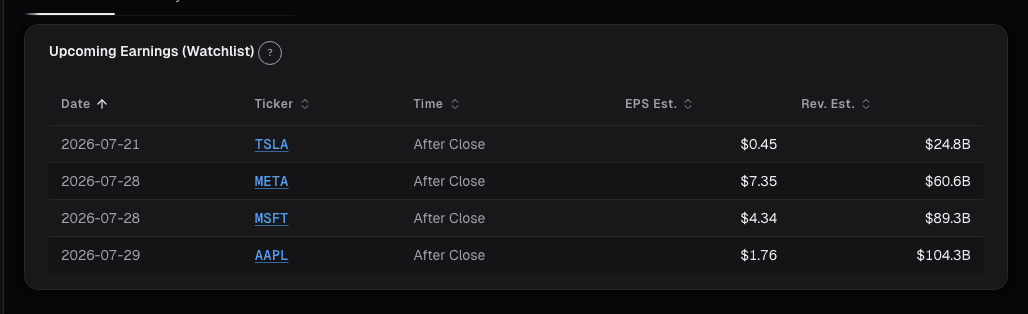
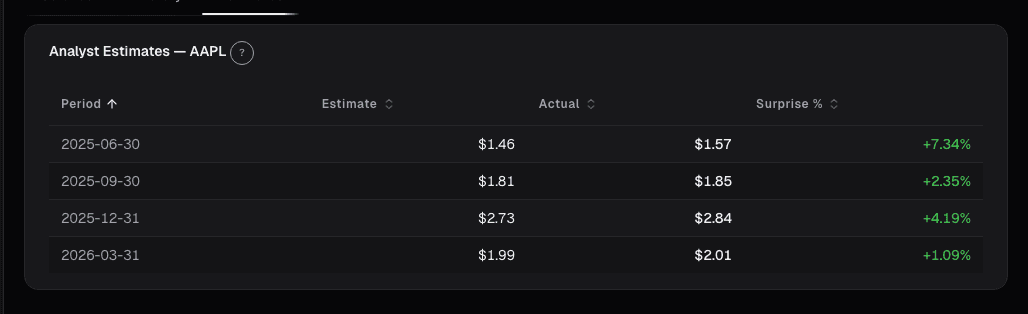
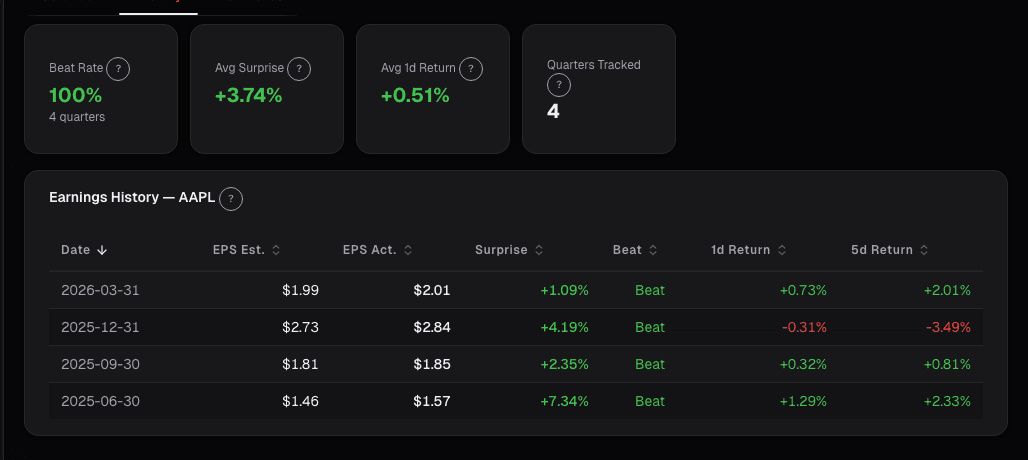
See it in the app
Live dashboard views that match this post. Each tile deep-links to the exact card.

Stocks mentioned
Ready to try alphactor.ai?
Validate your trading strategies with statistical credibility testing. Start free.
Get Started Free