Screener Results: Ranking, Scoring
A filter that returns 87 names isn't useful yet. You need to know which 15 to look at first, by what criterion, and what to do with the ranking.
 Marcus Chen6 min read
A few years ago I was running what I thought was a clean quality-value screen, F-Score ≥ 7, P/B in the sector's bottom 30%, 5-year ROIC > 12%. Screen returned 62 names. I sorted by market cap descending, read through the top 15, bought four, passed on the rest. Fast-forward six months: the four I bought returned an average of 3%; the S&P returned 9% in the same window. Post-mortem showed that when I re-ran the same screen sorted by quality-composite descending, the names I had bought ranked 22nd, 31st, 38th, and 44th in the original list. The *top* of the quality-composite ranking included five names I'd never looked at because they were all under $2B market cap and I'd sorted out of them by defaulting to the wrong column. Those five names returned an average of 18% in the same window. My screen wasn't wrong; my ranking was. "Screener output" and "screener ranking" are two different products, and the ranking is where most of the value lives, and also where most users don't think they need to spend effort.
This post is about the Screener Results card, how ranking interacts with filter intent, and the three practices that turn a 62-name list into a 10-name watchlist of names actually worth working.
TL;DR
- A filtered list isn't actionable until it's ranked. Default ranking should match filter intent.
- Multi-sort beats single-sort: quality descending, then price-to-52w-high descending, to get quality-on-a-retracement.
- Never act on the full list. The top 10-15 is what you work; the rest sanity-checks the screen.
- Composite scores reduce single-factor bias. A 7-dimension composite ranks more robustly than P/E alone.
- Compare screen outputs across regimes. The same screen returning different sectors across regimes is meta-information.
From filter match to actionable list
A screen that returns a large list is two steps from being useful. Step one is filtering, you've done that. Step two is ranking, deciding which 10-15 are worth deeper work and which 40-50 can be ignored. The ranking you apply is what converts "names that pass a filter" into "names ordered by how much they reward deeper work."
The right default ranking depends on the intent of the screen:
- Quality screen → composite quality score (F-Score + ROIC + accruals quality + earnings stability)
- Momentum screen → 6-month relative strength against sector
- Value screen → normalized valuation decile within sector (not absolute, because sectors have different valuation bases)
- Setup screen → current distance from the technical trigger (closest to trigger = highest rank)
- Growth screen → 3-year revenue CAGR with quality-filtered subset ranked first
Using the wrong default ranking, sorting by market cap when the screen intent was quality, is not a harmless mistake. It biases the top of your list toward names that pass the filter *and* happen to be large, which is a very different bucket than names that pass the filter *and* are best on the quality axis.
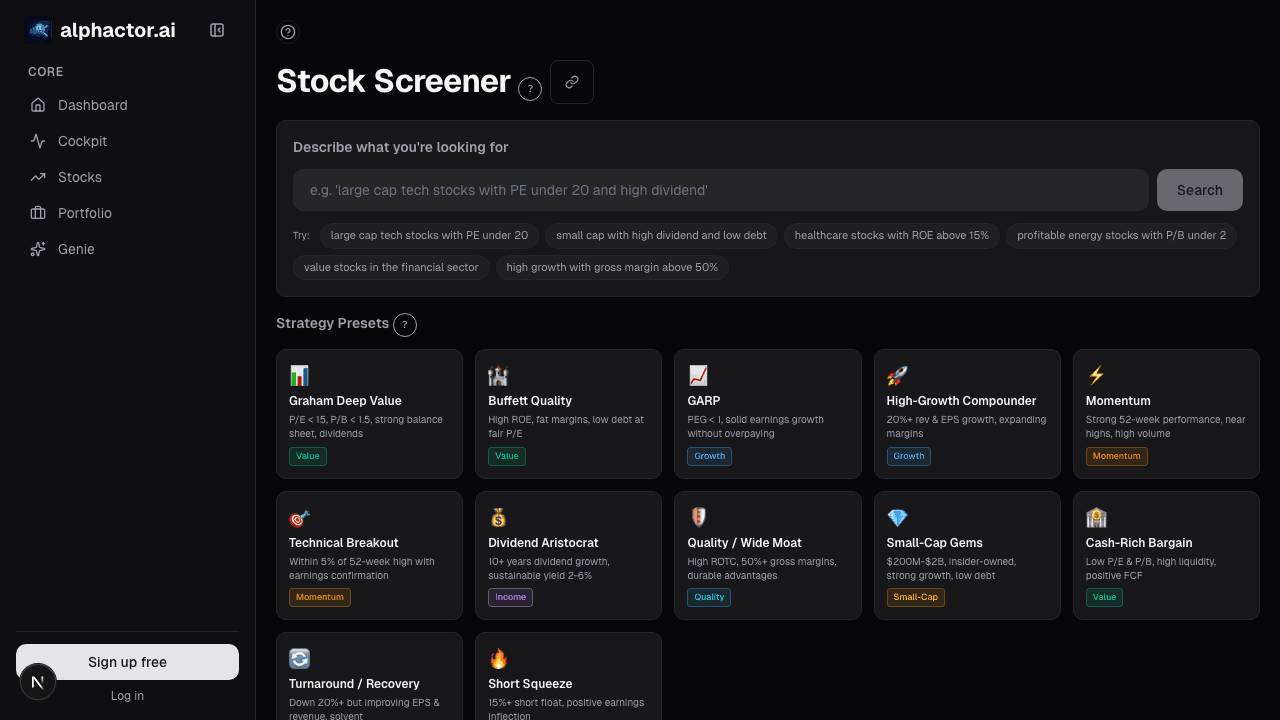
What the Screener Results card shows
The Screener Results card renders matches as a sortable, virtualized table:
- 50 rows per page, 20+ columns available, price, market cap, sector, 1d/5d/1m/3m/6m returns, relative strength vs. SPY and sector, P/E, PEG, FCF yield, conviction score, news sentiment 30d, regime-adjusted Sharpe
- Default sort by the composite score relevant to the active filter (user-tunable)
- Multi-column sort: up to 3 sort keys with priority
- Inline actions per row: add to watchlist, add to portfolio, open in chart, open in fundamentals
- Multi-select for bulk watchlist add or bulk export (CSV, Notion, Google Sheets)
- Saved screens: re-run a screen with one click; results snapshot stored for change analysis over time
- Composite-score tooltip: hover to see which factors contributed most to the ranking
Three practices that improve actionability
Sort by multiple criteria, not one. A single-column sort always over-weights one dimension. Quality descending + price-to-52w-high descending returns quality names on a retracement, a very different list from quality descending alone (which over-weights names already near highs) or price-to-52w-high descending alone (which includes low-quality names that have sold off for good reasons). Multi-sort captures the intersection.
Never act on the full list. If a screen returns 87 names, you are going to look at the top 10-15 in detail. The other 70-ish exist to sanity-check that the screen isn't returning junk (if names 70-87 look like obvious low-quality names, the screen is probably fine). The top 10-15 get fundamentals drill-downs, the next 15-30 get watchlist adds, the bottom half gets ignored.
Compare results across regimes. The same screen often returns very different sector mixes in a low-vol uptrend vs. a correction. A quality screen in a trending-up regime tends to return growth names; the same screen in a correction regime tends to return defensives. That meta-information is information, the screen is telling you where quality lives in the current regime, which is often more useful than the specific names.
Example: quality-value screen, two rankings
Same screen, same day, two rankings:
| Rank by market cap | Rank by quality composite |
|---|---|
| Large-cap, moderate-quality name | Small-cap, very-high-quality name |
| Large-cap, moderate-quality name | Mid-cap, very-high-quality name |
| Large-cap, moderate-quality name | Small-cap, high-quality name |
| Mid-cap, moderate-quality name | Mid-cap, high-quality name |
| Mid-cap, high-quality name | Large-cap, high-quality name |
In my case the "large-cap first" ranking put my four eventual buys in the top 15; the "quality composite" ranking put the best 5 names (by the factor the screen was built to surface) in the top 5. Using the composite ranking would have changed which names I actually looked at, and, in hindsight, would have materially changed my returns. Not because the screen was different, but because the ranking was different.
What the screener can't tell you
- Forward performance. Historical factor rankings don't guarantee future outperformance.
- Liquidity. A top-ranked small-cap may be untradeable at the size you need. Always check ADV before acting.
- Catalysts. Rankings summarize state, not events. An earnings-week name ranks the same as a post-earnings name; the actionable context differs.
- Portfolio fit. A high-ranking name may already correlate heavily with existing holdings; the screener doesn't know about your portfolio.
- Regime appropriateness. A quality screen ranks quality names regardless of whether quality is in favor today.
Common mistakes
- Sorting by a single column when the screen has multi-factor intent.
- Acting on all matches. 50+ names acted on without individual due diligence is how retail books end up with too-many-positions-to-monitor.
- Ignoring the composite-score tooltip. The factor attribution often reveals that a high rank is driven by one dominant factor you didn't intend to weight.
- Forgetting to re-run the screen periodically. A screen run quarterly refreshes the matches; a screen run once and never revisited is stale by Q2.
- Over-trusting the ranking as a buy list. Ranking narrows the work; it doesn't complete the decision.
Where it fits
Pair with Screener Filters for the composition side, then drill into any result via the Conviction Gauge or Peer Comparison card. For the broader market context beyond your filter, cross-reference with Universe Heatmap. The Universe Scanner is the complementary workflow when you want to scan across sectors rather than inside a specific filter.
FAQ
Can I build a custom composite score?
Yes, premium users can tune factor weights on the composite. The card shows the composite breakdown for each row on hover.
How many screens can I save?
Unlimited on paid tiers. The saved-screens panel keeps historical snapshots for change-over-time analysis.
Do the rankings update intraday?
Price-based columns (returns, RS) update every 15 minutes; fundamentals-based columns update on filing. The composite score refreshes nightly.
Can I export rankings to my own analysis tool?
Yes, CSV, XLSX, Notion, and Google Sheets exports. API access for enterprise tiers.
What's the difference between "screener results" and "universe scanner"?
Screener results are the output of a user-defined filter. Universe Scanner is a cross-sector scanning view that surfaces outliers without a user-specified filter. Use Screener for targeted lists, Scanner for market sweeps.
Related reading
Open the Screener Results → /app/screener
See it in the app
Live dashboard views that match this post. Each tile deep-links to the exact card.
Stocks mentioned
Related reading
How to Screen 1,000 Stocks in Under a Minute
Learn how to use Alphactor's universe scanner to filter thousands of stocks down to a focused shortlist using quantitative criteria.
Screener Filters: Composable Queries Over the Full Universe
Fixed-form screeners answer the most common queries and nothing else. A composable filter stack, fundamentals + technicals + sentiment + regime, with…
3 Universe Scanner Workflows for Finding Your Next Trade
Practical workflows using Alphactor's Universe Scanner to find actionable buy and sell signals, sector rotations, and high-credibility setups.
Ready to try alphactor.ai?
Validate your trading strategies with statistical credibility testing. Start free.
Get Started Free