Investor Diff: Turning Quarterly 13Fs Into Signal
A 13F snapshot is a photograph; the diff is the motion picture. Knowing what Klarman or Marks held last quarter is weakly useful, knowing what they added…
 Marcus Chen7 min read
In August 2023 the Q2 13Fs dropped and I did what I do every quarter, pulled the diffs on the 30 managers I track closely. One specific pattern stood out on a mid-cap industrial that had drawn down 27% over the prior three months on a capex guide-down. Four of my high-conviction managers, two deep-value, one quality-GARP, one special-situations, had all added 20-40% to existing positions in the same quarter. One had crossed over the 3%-of-AUM conviction threshold. None of them had initiated the name that quarter; they'd all held through the drawdown and added into it. That pattern (hold → add into weakness, multi-manager, same quarter) is rare enough that I track it explicitly. It's different from the single-manager-adds case and very different from "X funds hold this name" which is what most 13F headlines show. I built a position in the stock over the following two weeks at an average price 4% above the quarter-end. Six months later the name was up 38% as the capex story turned out to be a forward-investment cycle rather than a structural problem. The 13F diff didn't invent the thesis, I'd been watching the name, but it was the specific activation signal. Four managers I respect, adding simultaneously, into weakness, at the same time. That's what the diff shows that the snapshot never can.
This post is about the Investor Diff card, why the quarter-over-quarter view is the only 13F view that carries real information, and the three patterns that have been the highest-signal in my own trading.
TL;DR
- A 13F snapshot tells you what a fund owned; only the diff tells you what they did.
- New positions and exits are cleaner signals than adds/trims: they're categorical state changes.
- Adds into weakness by high-conviction managers are rare and have historically outperformed.
- 8+ quarter-tenure exits usually mean a thesis change; worth investigating the public record.
- Cluster behavior across 5+ managers is the strongest signal class: coordinated accumulation or distribution.
Why the diff matters more than the snapshot
A single 13F snapshot is a backward-looking inventory. It tells you what a fund held at the quarter-end, roughly 45 days before you're seeing it. That information decays quickly and isn't useful on its own unless you're studying a manager for the first time. The diff, by contrast, is an activity record. It tells you what the fund *did* during the quarter:
- New initiations: thesis-level conviction to deploy capital
- Full exits: thesis-level conviction to remove capital
- Adds of >10%: meaningful conviction increase on existing holdings
- Trims of >10%: meaningful conviction reduction
- Conviction threshold crossings: when a position crosses the 3%-of-AUM line in either direction
Those five categories are where the signal lives. A fund owning a name you're researching is noise; a fund *initiating* a name you're researching, at significant size, after 6 years of not owning it, is a real decision point by a professional that you can weigh against your own view.
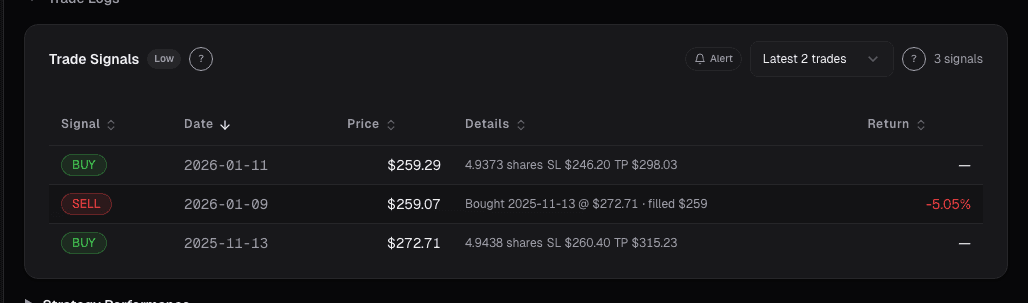
What the Investor Diff card shows
The Investor Diff card compares a selected filer's current 13F to the prior quarter and buckets changes into four categories:
- New positions: not held last quarter, initiated this quarter (sized by starting weight)
- Exits: held last quarter, absent this quarter (flagged with tenure of the prior holding)
- Adds: existing position increased by > 10% of shares
- Trims: existing position reduced by > 10% of shares
Each row shows:
- Share change and dollar change
- % of AUM change: the size-normalized move
- Ticker price action over the quarter: so you can see whether the filer was adding into strength or weakness
- Conviction threshold flag: crossed 3%-AUM up or down
- Tenure: for exits, quarters held prior to exit
- Post-move weight: the new position size
Additional views:
- Cross-filer aggregation: see which tickers had the most initiating filers this quarter
- Cluster analysis: tickers where multiple top-decile managers all acted the same direction
- Historical diff archive: every quarter's diffs, for historical pattern study

Three patterns that have been highest-signal
Adds into weakness by high-conviction managers. If a manager whose judgment you respect added 20-50% to an existing position during a quarter when the stock was down 15%+, that's a much stronger signal than the same manager initiating a name. Adds into weakness require conviction under discomfort, the manager watched their existing position mark down, and chose to put more money in rather than trim or hold. That behavior pattern has historically preceded 3-6-month outperformance when clustered across multiple managers. Single-manager adds are more noise than signal; 3+ managers adding simultaneously into the same weakness is the signal band.
Exits after 8+ quarter tenure. Long-held positions don't usually get trimmed and eventually exited, they're usually held through cycles unless something fundamental changed. A manager who held a name for 10 quarters and fully exits in one quarter is making a thesis-level decision, not a trading call. These exits are worth investigating even if you're long the name, the manager has information, an interpretation, or a conviction-shift you should understand. Cross-reference with any public letters, interviews, or commentary the manager has made; sometimes the exit reason is in plain sight.
Cluster behavior across 5+ managers. When 5+ top-decile managers initiate the same name in the same quarter, the setup is genuinely unusual, the coordination isn't coordinated, but the fundamentals have to be clear enough that multiple independent processes arrived at the same decision. Cluster accumulation has historically preceded strong outperformance; cluster distribution (5+ managers exiting simultaneously) has historically preceded underperformance and sometimes negative surprises. Filter the diff card by "multi-filer initiations" and "multi-filer exits" to surface these clusters explicitly.
Example: the August 2023 industrial
The diff snapshot from Q2 2023 for the mid-cap industrial I traded:
| Manager | Action | Share Change | Q2 Price Action | Post-Move Weight | Conviction Crossed |
|---|---|---|---|---|---|
| Manager A (deep-value) | Add | +35% | -27% | 4.2% | Yes (↑3%) |
| Manager B (deep-value) | Add | +22% | -27% | 5.8% | No (already > 3%) |
| Manager C (quality-GARP) | Add | +40% | -27% | 3.1% | Yes (↑3%) |
| Manager D (special-sit) | Add | +28% | -27% | 2.9% | No (below 3% threshold) |
| Consensus pattern | , | , | Down 27% | , | Two conviction crossings |
Four managers, all adding 20-40%, all into a 27% drawdown, two of them crossing into conviction-position territory. No manager initiated, every one had held the name through the drawdown and chose to add. The pattern was specific enough that I built a position over the two weeks following the filing release. The absence of exits mattered too, no high-conviction manager was trimming or exiting. That consensus-add-into-weakness pattern with no offsetting distribution is the signal I look for. The 38% subsequent move wasn't a prediction; it was the thesis playing out roughly as the four managers had presumably modeled it.
What the diff can miss
- Intra-quarter round trips. A fund could have bought and fully sold within the quarter; the 13F won't show it.
- Short positions. 13Fs are long-only disclosures; a manager could be simultaneously short something else that's informative.
- Options and hedges. Some derivative positions appear on 13Fs, many don't. The true exposure can differ from the reported one.
- Manager turnover. A 13F diff for a fund that changed its portfolio manager mid-quarter reflects two different people's decisions.
- 45-day reporting lag. By the time you see the diff, prices have moved; the add-into-weakness may already be priced in.
Common mistakes
- Reading single-manager adds as signal. One manager is usually noise; clusters are signal.
- Ignoring exits. Exits by long-tenure holders are often more informative than new initiations.
- Weighting by dollar size rather than % of AUM change. A $500M position change is small for a $100B fund and enormous for a $1B fund.
- Ignoring the price action. An add into strength is different from an add into weakness; the context matters.
- Copy-trading without understanding the thesis. The diff tells you *what*; you still have to understand *why*.
Where it fits
Pair the Investor Diff card with Investor Holdings for the static book context, Institutional Holders for the per-ticker view of who's in and who's out, and Conviction Components to see how the 13F flows factor into per-name conviction scoring. When a ticker has both positive cluster diff activity and positive insider transactions, two independent signal sources are agreeing, a rare and worthwhile setup.
FAQ
How fresh is 13F data?
13Fs are filed within 45 days of quarter-end. The diff card is updated within 24 hours of each filing arriving.
Can I track multiple filers at once?
Yes, build a watchlist of up to 50 filers and see a consolidated diff view across all of them.
What defines a "top-decile" manager?
Multi-year risk-adjusted return rank within the card's universe of ~500 tracked active managers, re-scored annually.
Can I see the full diff history for one ticker?
Yes, pivot the view from filer-centric to ticker-centric and see every filer that has initiated, exited, added, or trimmed the name across quarters.
Does the card show short positions?
Only what is reportable on the 13F (long positions and some derivatives). Pure short positions are not disclosed.
Related reading
Open the Investor Diff card → /app/investors
See it in the app
Live dashboard views that match this post. Each tile deep-links to the exact card.
Stocks mentioned
Related reading
Congress Diff: What Legislators Bought and Sold This Quarter
One senator's $50k buy isn't a thesis. Thirty members of Congress netting positive in Big Tech while netting negative in regional banks is, because the…
How to Read 13F Filings Without Falling Asleep
A plain-language guide to understanding 13F filings, what they reveal about institutional investors, and how to use Alphactor's 13F explorer to spot…
13F Holders: Who Owns This Stock
Raw ownership is already in the price. What isn't is portfolio-weight change, when a concentrated fund lifts a position from 1% to 4% of its book, that's a…
Investor Holdings
Studying a single manager's full book is pedagogy for portfolio construction. Concentration, position sizing, sector expression, how convictions survive…
Ready to try alphactor.ai?
Validate your trading strategies with statistical credibility testing. Start free.
Get Started Free