Paper Trading Order History
Most traders have no idea what their actual edge looks like. An honest, complete order history is where that knowledge lives, reviewed weekly, it reveals…
 Marcus Chen6 min read
A friend who traded for fifteen years once told me that the single highest-ROI time he ever spent was the quarter he went back through his full order history and tagged each trade with its setup type. He'd been trading "his system" for a decade. When he actually measured, the results broke into three buckets: one setup that produced virtually all his profit, one that was roughly break-even, and two that were net-negative. He stopped trading the last two. Returns went up 30% over the next year not by getting better at trading, but by trading less of what wasn't working. The data was in his order history the whole time; he'd just never looked at it that way.
This post is about the Paper Trading Order History card, the three reviews that produce disproportionate insight, and why retrospective analysis of your own execution is the single most under-used learning tool in trading.
TL;DR
- Most traders remember wins and forget losses. Biased sample, biased conclusions.
- Setup-tagged order history is where edge becomes visible. The math isn't hard; the discipline of tagging is.
- Slippage vs. model is a self-graded execution score. Chronic over-slippage means you're chasing.
- Time-of-day distribution reveals regime mismatches. Losses cluster in your worst execution windows.
- Weekly review beats quarterly review. Pattern recognition needs frequent loops to calibrate.
Trade records are where learning lives
The issue with learning from your own trading is that memory is a biased sample. Wins are vivid, losses blur, and near-misses get retold as "almost wins." Without a complete, timestamped, machine-recorded log, any conclusions you draw about your own trading are based on a 15–20% sample of your actual history, filtered through emotional relevance rather than statistical representativeness.
An honest order history fixes the sample. It contains every trade, filled, partially filled, canceled, expired, with timestamps, sizes, fill prices, modeled slippage, and realized P&L. You can't pretend a losing trade didn't happen because it's right there with a timestamp. You can't retroactively tell yourself you would have held longer because the exit time is in the record. The log makes your trading history unfalsifiable by your memory, which is precisely what you need for it to be useful.
What the Order History card shows
The Paper Trading Order History card lists every order placed:
- Timestamp: placement, fill (or cancel/expire)
- Order type: market, limit, stop, stop-limit, bracket
- Ticker, direction, quantity
- Requested price and fill price: so you can see slippage
- Modeled slippage in cents/bps: what the simulation assumed vs. what actually filled
- Duration: how long between placement and fill
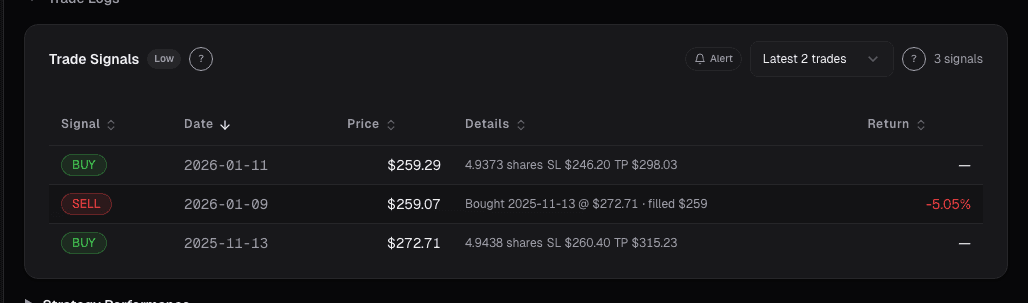
- Round-trip outcome: win, loss, or break-even for closed trades, with realized P&L
- Setup tag: free-text label you apply at entry time (breakout, pullback, earnings, news, etc.)
- Post-trade review checkbox: for marking which trades you've reviewed
Filters slice by ticker, order type, date range, outcome, setup, and time-of-day. CSV export is one click. Each row links back to the chart at the fill time so you can see the tape context.
Three reviews that produce insight
Win rate by setup type. Group closed trades by the setup tag you applied at entry and compute hit rate, average win, average loss, and expectancy (hit rate × avg win - miss rate × avg loss) per setup. The typical finding is that one or two setups do the real work and the rest dilute returns. The extreme version is the anecdote at the start of this post, three setups that net to negative, canceling most of the profit from the one that works. Action: stop trading the losers. The psychological hurdle is that losing setups often feel good while you're in them (because you only remember the wins); the math is the correction.
Slippage vs. the slippage model. For each trade, compare your actual fill quality (for market orders: fill price vs. quote at placement) to the model's assumption. Consistent over-slippage means you're chasing, entering on market orders when the quote has already moved against you. Consistent under-slippage means you're lucky or the model is too pessimistic. The average is what matters; if your realized slippage is 2× the model on average, your entries are costing you real money that systematic discipline would save.
Time-of-day distribution of losses. Plot your realized P&L by the hour of execution. Most retail traders have a time-of-day execution quality curve, best in the mid-morning after the initial open chop, worst in the first 30 minutes and last 30 minutes. If your history shows a strong time-of-day loss pattern, the fix is free: stop trading those windows. You'll lose some opportunities but you'll save more in avoided losses. The discipline is recognizing the pattern is yours, not the market's.
Example: a setup-tag review
My own Q1 2025 paper-trading review, tagged across 147 closed round-trips:
| Setup | Trades | Win rate | Avg win | Avg loss | Expectancy |
|---|---|---|---|---|---|
| Earnings post-drift | 18 | 61% | $420 | $280 | $146 |
| Momentum breakout | 41 | 49% | $310 | $270 | $14 |
| Pullback to 20-day | 52 | 43% | $290 | $310 | -$52 |
| News-driven fade | 22 | 55% | $340 | $220 | $88 |
| Earnings pre-position | 14 | 36% | $380 | $420 | -$132 |
The takeaways were uncomfortable. My most-traded setup (pullback to 20-day, 52 trades) was my worst on expectancy. My smallest-by-volume setup (earnings post-drift, 18 trades) was my best. I'd been intuitively weighting away from the thing that was working. The review didn't make me a better trader; it told me to do more of one thing and less of another. That's the whole game.
What the card won't fix
- It doesn't tell you *why* a setup is losing. Only that it is. The "why" requires qualitative review of individual trades.
- Small samples lie. Any setup with < 20 trades is still statistically noisy. Don't retire a setup on 8 trades.
- Setup tagging is only as good as you are. If you apply "breakout" to everything, the tagging is useless. Be narrow and consistent.
- The log covers paper only. Live execution has different dynamics; lessons from paper generally transfer, but not perfectly.
Common mistakes
- Not tagging at entry. Retroactive tagging drifts toward "I was right about this one" bias. Tag at the time of the trade.
- Reviewing only closed wins. The closes you need to study most are the losses.
- Skipping the time-of-day cut. It's the fastest single fix for most execution problems.
- Too many setup tags. Five to eight tags is plenty. If you have 20, you can't get enough trades per tag for statistics to mean anything.
- Reviewing once a quarter. Weekly review keeps the feedback loop tight. Quarterly is too slow, you'll have 100+ trades with drifting memory by then.
Where it fits
The Order History card is the after-action review surface. Pair with Paper Trading Account Summary for the aggregate scoreboard, Paper Trading Order Entry for the rehearsal side, and Paper Trading Coach, the coach reads your order history directly and surfaces pattern flags you might miss in manual review.
FAQ
How long is the history retained?
Full history indefinitely. The card displays the trailing 12 months by default; longer ranges via the date filter.
Can I export to spreadsheet?
Yes, CSV export includes every field shown in the card plus a few (request timestamps, cancel reasons) that aren't in the default columns. Most traders do their deep analysis in Excel / Python.
What if I didn't tag setups at entry time?
Retroactive tagging is possible but bias-prone. If you're just starting tagging, accept that the first 30 days of historical trades have weaker tags; do it right going forward.
Does this work for options paper trades?
Yes, options orders are logged with strike, expiry, and option-type fields in addition to the equity fields.
How does the slippage model work?
The model fills market orders at the displayed bid/ask cross with a small additional haircut for liquidity; limit orders fill probabilistically based on price touches and volume at the limit. The modeled slippage in the card is the haircut applied.
Related reading
Open the Order History card → /app/paper-trading
See it in the app
Live dashboard views that match this post. Each tile deep-links to the exact card.

Related reading
How to Paper Trade Without Fooling Yourself
How to use paper trading in Alphactor to test strategies honestly, avoid common self-deception traps, and build confidence before risking real capital.
Paper Trading Account Summary
Paper trading works only when you treat it like a real book. The Account Summary card on alphactor.ai tracks cash, positions, P&L, and execution quality so…
Paper Trading Coach
A log of your trades is only useful if you review it honestly. The Coach reads your fills against your stated rules and tells you, directly, with numbers …
Paper Trading Order Entry: Practicing the Trade
A good trade idea is only half the job. The Order Entry card lets you rehearse the actual execution, order type, size, stop, target, so the mechanics are…
Keeping a Trading Journal
A trading journal is the cheapest, most effective tool for improving performance. Here is what to track, how to review it, and why most people quit too soon.
Ready to try alphactor.ai?
Validate your trading strategies with statistical credibility testing. Start free.
Get Started Free