Moving Average
A rolling average of price over a lookback window, used to smooth noise and identify trend.
Simple moving average (SMA): `SMAₙ = Σ Price over last n days / n`. Exponential moving average (EMA) weights recent prices more heavily; 50-day and 200-day are the most-watched windows.
Why it matters. The 200-day SMA is the most-cited primary trend filter: above it = uptrend, below it = downtrend. Golden cross (50-day crossing above 200-day) and death cross (the reverse) are simple trend-following signals with decades of out-of-sample evidence, especially at the index level.
Pitfalls. Moving averages *lag* price by construction, the longer the window, the larger the lag. They whipsaw in ranging markets, so filter signals with regime indicators (e.g. realised vol, VIX) or volatility-scaled position sizing.
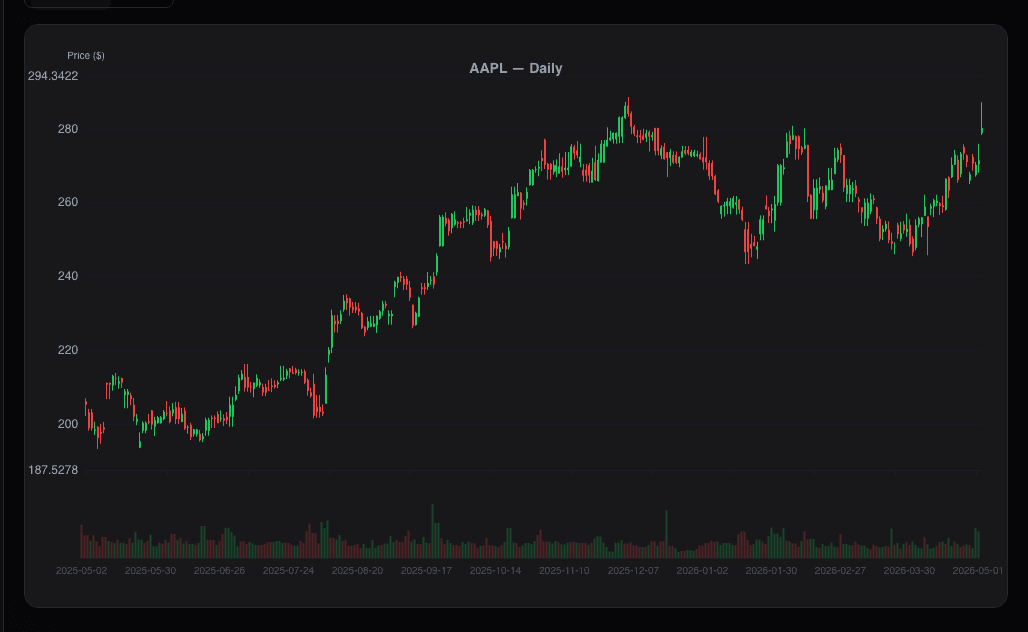
See it applied
Related reading
- Turn Your Watchlist Into an Active Research System
A passive watchlist wastes your time. Learn how to turn yours into a system that surfaces actionable intelligence on the stocks you care about.
- Portfolio Monitoring With Less Noise
Most portfolio dashboards show you everything. Here is how to filter down to the changes that actually require your attention.
- Cockpit Cards: Quick-Glance Intelligence per Stock
How cockpit cards surface the signals, events, and changes that matter most across your watchlist and portfolio without information overload.