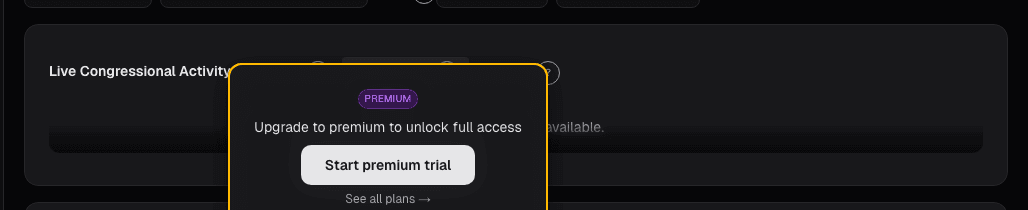
Congress Live Activity: Legislator Trades in Near-Real-Time
Congress Live Activity aggregates STOCK Act filings with jurisdictional flags and cluster alerts, turning scattered PDFs into a scannable daily signal.
 Marcus Chen7 min read
In March 2023 I was scrolling the Congress Live Activity feed with the jurisdictional filter on and noticed three Senate Banking Committee members had filed disclosures in the same week, all selling shares of two specific mid-cap regional banks. None of the individual sales were huge, the disclosed ranges were $15-50k each. What struck me wasn't the absolute size; it was the timing: three sells clustered inside a five-day window, from three different members with jurisdictional oversight, into names that had been holding up reasonably well on the tape. I dug in, and found a Banking Committee hearing scheduled for the following week to question regional bank capital adequacy in the wake of the early-March SVB failure. I didn't short the names (sizing and compliance reasons I won't get into here), but I did pull my small long exposure to the regional banks sector the same day I flagged the cluster. Both names dropped 12-18% over the following three weeks; one of the two was eventually part of the extended regional bank selloff through Q2. The individual disclosures, read in isolation, were unremarkable. The cluster with jurisdictional overlap was the signal.
This post is about the Congress Live Activity card, why the raw feed is noisy but the filtered feed is informative, and the three reads that separate "politicians trading stocks" from "politicians trading something specific."
TL;DR
- STOCK Act disclosures are public but scattered across hundreds of PDFs at varying cadences; a single feed is the unlock.
- Jurisdictional flags are where the signal concentrates. A Banking member trading a bank is higher-information than the same member trading a semiconductor.
- Size-range escalation matters. A legislator whose typical disclosures are $1-15k filing a $500k+ range has made a deliberate decision.
- Cross-chamber clusters lead hearings and votes. Multiple jurisdictional members trading the same name inside a 2-week window is often pre-positioning.
- The 45-day disclosure lag is why aggregates matter more than timing: individual stale trades can't be front-run; patterns still can.
Why legislator trades are a distinct signal
Under the 2012 STOCK Act, members of Congress and senior staff must disclose trades within 45 days of execution. The 45-day window makes individual trades too stale for front-running, by the time you see the disclosure, the price has often moved. What remains informative is the *pattern*: committee chairs trading names under their jurisdiction, Armed Services members buying defense contractors in budget-authorization quarters, Banking Committee members adjusting regional bank exposure ahead of oversight hearings.
The academic literature is mixed on whether individual legislator trades generate alpha on average. The more-robust finding is that *committee-relevant* legislator trades outperform, and that clusters across members outperform single trades. Both findings are consistent with the legislative workflow: members on relevant committees see bills and budget markups before the public does, and members who agree on a policy direction often position similarly around it.
A feed of all disclosures, filterable by chamber, committee, and ticker, turns the STOCK Act from disclosure-theater into a usable dataset. The raw PDFs on congressional websites are unusable at scale; the filtered feed makes the outliers visible.
What the Congress Live Activity card shows
The Congress Live Activity card is a rolling feed of legislator trade disclosures, ordered by filing date (newest first):
- Legislator: name, chamber, party, state
- Committee assignments: all committees, with jurisdictional relevance to the trade highlighted
- Ticker + direction: buy, sell, option-exercise, option-trade
- Size range: the STOCK Act discloses ranges, not exact amounts ($1k-15k, $15k-50k, $50k-100k, etc.)
- Trade date vs. filing date: to see the disclosure lag for each individual trade
- Jurisdictional flag: when the ticker is within a committee domain the member serves on
- Cluster flag: when the same ticker has multiple member disclosures inside a 14-day window
- Filter dropdowns: chamber, committee, party, sector, ticker
Three reads that add signal
Jurisdictional flags. A Financial Services Committee member buying a bank before a hearing, or a Health Committee member buying a pharma before an FDA decision, has an implied information advantage that generic trades don't. The flag is visible per-row; I filter the feed to "jurisdictional only" about 60% of the time because the base rate of the flagged subset is higher.
Size-range escalation. Most legislator disclosures fall in the $1k-50k bucket, routine portfolio management. A legislator whose history is consistently small who suddenly files a $500k or $1M+ disclosure has made a deliberate sizing decision. The escalation is the signal, not the absolute level. The card tracks each member's historical size distribution so the outlier is visible.
Cross-chamber clusters. When multiple members, especially across both House and Senate, in the same committee all trade the same name the same direction inside a 14-day window, a briefing, hearing, or vote is often behind the cluster. The cluster flag surfaces these automatically. Single-trade reads are noisy; cluster reads are much tighter.
Example: the March 2023 regional bank cluster
The relevant disclosures I was watching:
| Member | Chamber | Committee | Direction | Ticker | Range | Trade date |
|---|---|---|---|---|---|---|
| Senator A | Senate | Banking | Sell | Bank 1 | $15-50k | Mar 13 |
| Senator B | Senate | Banking | Sell | Bank 2 | $50-100k | Mar 14 |
| Senator A | Senate | Banking | Sell | Bank 2 | $15-50k | Mar 15 |
| Senator C | Senate | Banking | Sell | Bank 1 | $1-15k | Mar 17 |
Three Banking Committee senators, two names, all sells, inside a five-day window, ahead of a scheduled Banking Committee oversight hearing on regional bank capital adequacy. The individual trades aren't large. The cluster is. Both names declined materially over the following month; one was eventually part of the broader regional bank selloff through Q2 2023. The feed caught the cluster two-to-three weeks before the decline accelerated.
The specific lesson: filter-first reading. Sorted by filing date alone, these four disclosures would have been buried inside a 200+ disclosure week. Filtered to "jurisdictional + cluster" they were the top of the feed.
What the feed won't catch
- Spouse and dependent trades are disclosed but often carry less signal than direct member trades. The card labels them; decide how to weight.
- Private market and real estate transactions outside of publicly-traded securities are outside the STOCK Act and outside the feed.
- Trades by staff that aren't senior enough to trigger reporting. Lower-level committee staff are sometimes better positioned informationally than the members themselves and don't file.
- Intra-day trade timing. The disclosure is at trade-date granularity; intraday timing isn't visible.
- Hedge or options context. A legislator who sells stock while holding calls has a net-neutral position that reads as bearish on the feed; the feed doesn't aggregate across strategies.
Common mistakes
- Reading single trades in isolation. Most individual disclosures are noise. The filters exist for a reason.
- Over-weighting the highest-range disclosures. A $1M+ range can dominate the feed visually; it doesn't always dominate the signal.
- Ignoring the committee relevance. A Senator trading a semiconductor with no committee connection is much weaker signal than the same trade from a senator on Commerce.
- Trading directly on stale disclosures. The 45-day lag is long enough that individual trades are often priced-in by the time you see them. The pattern matters, not the timing.
- Party-coding the signal. The card is party-agnostic; filtering by party usually doesn't add predictive value and does add confirmation bias.
Where it fits
Pair with the per-ticker Congress Summary card for the single-name drill-down, Congress Activity for the rolling book view, and Congress Diff for the quarter-over-quarter sector-level aggregates. For the policy-side complement, use Corporate Lobbying Spend. When legislator flow and lobbying both align on a name, the policy-driven thesis is on much firmer ground.
FAQ
How fresh is the feed?
Updates within hours of each disclosure being filed. Filings themselves have up to 45 days of lag behind the trade date; the card can't help that.
Does the card distinguish spouse trades?
Yes, spouse and dependent trades are labeled separately. Some traders filter them out; I include them at lower weight.
Can I alert on jurisdictional clusters?
Yes, Trade Alerts supports cluster alerts (e.g., "fire when ≥3 Banking Committee members file same-direction trades on a ticker within 14 days").
What about PAC and campaign finance disclosures?
Separate regime (FEC). Not on this card. Cross-reference the FEC database for campaign-side flows.
Does legislator trading actually generate alpha?
Mixed evidence in the academic literature. The more-robust finding is that committee-relevant clusters outperform; individual trades don't. That's consistent with how the feed should be read, patterns over points.
Related reading
Open the Congress Live Activity card → /app/congress
See it in the app
Live dashboard views that match this post. Each tile deep-links to the exact card.
Stocks mentioned
Related reading
Congress Diff: What Legislators Bought and Sold This Quarter
One senator's $50k buy isn't a thesis. Thirty members of Congress netting positive in Big Tech while netting negative in regional banks is, because the…
House Trades: Per-Ticker Flow From the Lower Chamber
Representatives trade under the STOCK Act like senators, but House flow has a different character, shorter terms, narrower districts, and more industry…
Senate Trades: The Upper Chamber's Equity Flow
Senate committee-overlap signal is stronger than House trades. One-sided flow from Armed Services or Banking members is highest-information political signals.
Congressional Trades on a Single Stock
The 'Congress outperforms the market' story hides where the actual signal is. It's not aggregate Congressional portfolios, it's a single committee chair's…
How to Track Congressional Stock Trades (And Why You Should)
How to use Alphactor's congressional trade tracker to monitor stock transactions disclosed by US lawmakers and incorporate them into your research.
Ready to try alphactor.ai?
Validate your trading strategies with statistical credibility testing. Start free.
Get Started Free