Senate Trades: The Upper Chamber's Equity Flow
Senate committee-overlap signal is stronger than House trades. One-sided flow from Armed Services or Banking members is highest-information political signals.
 Marcus Chen7 min read
In late 2019 and early 2020, several U.S. Senators executed equity trades that later drew SEC, DOJ, and ethics-committee attention. The legal outcomes varied; the investor-relevant fact is simpler: these are the trades of people who sit in closed committee briefings on semiconductor export policy, defense procurement, pharmaceutical approvals, and financial regulation. Under the STOCK Act (2012), those trades are disclosed publicly, with a lag of up to 45 days. That lag is long by markets standards, but the signal is often durable enough to survive it, senators tend to be positioning for medium-horizon theses, not next week.
This post is about why I read Senate disclosures separately from House disclosures, what the Senate Trades card on a ticker's sentiment view actually displays, and the two signals that hold up best in my experience.
TL;DR
- Senate and House are not interchangeable. Different term lengths, different constituency breadths, different committee powers.
- Committee overlap is the real signal. A defense contractor getting bought by Armed Services senators is a different event than one getting bought by senators on agricultural committees.
- One-sided, multi-senator flow beats isolated single disclosures. A lone senator's trade is rarely informative; a concurrent pattern across four or more is.
- Disclosure-lag > 40 days is a yellow flag. Late-to-the-cap filings correlate with trades that turn out to be more material than clerical.
- The data is public. The alpha is in the aggregation and the context, not the access.
Why the Senate is different from the House
Senators serve six-year terms, represent entire states, and sit on committees whose jurisdictions are narrower and deeper than most House equivalents. The Senate Banking Committee, Senate Armed Services, Senate Intelligence, Senate Judiciary, these sit on briefings with unique granularity, including closed sessions on mergers, export controls, defense-procurement timing, and bank-stress-test methodology.
House members by contrast represent narrower districts with shorter two-year cycles. House committees have more members, more turnover, and historically less signal per disclosure. Academic studies, Ziobrowski 2004 and its follow-ups, Chen et al. 2017, find that Senate portfolios have historically produced higher risk-adjusted excess returns than House portfolios in the pre-STOCK-Act era. The effect has weakened since disclosure became more timely, which is precisely what you'd expect: the excess return was partly the option value of private information, and shortening the disclosure window compresses that option.
What hasn't gone away is the informational value of *specific committee overlap.* A senator on the Armed Services Committee buying a defense prime's stock is a different signal than a senator on Agriculture doing the same, because only the first has persistent exposure to non-public, non-market-making information about the company's end market.
What the Senate Trades card shows
The Senate Trades card lists every STOCK Act disclosure for the viewed ticker by senators and senior staff:
- Senator name and whether the disclosure was filed by the senator directly or by a spouse or dependent
- Party and state: party context lets you filter for bipartisan flow (which is a stronger signal than one-party flow)
- Committee assignments with a jurisdictional flag if the ticker's primary business falls under a committee the senator serves on
- Trade date / filing date / disclosure lag: the lag between execution and public filing, capped at 45 days by statute
- Direction: buy, sell, or option transaction, with option disclosures separated because the information content is different
- Size range: disclosures report ranges ("$1,001–$15,000", "$15,001–$50,000"), not exact amounts
A roll-up strip at the top of the card shows 12-month totals: net buys and sells segmented by party, by committee, and by disclosure-lag category. The roll-up is how you see whether the ticker's Senate flow is one-sided or balanced, and whether the flow concentrates in the committees that matter.
The two patterns that hold up
One-sided, multi-senator, relevant-committee flow. If four senators on Armed Services are net-long a defense contractor over the past six months and zero are net-short, that cluster is among the highest-information political signals available to public investors. It doesn't mean buy immediately, you still need to understand what's in the stock price, but it means multiple people in the closed-briefing loop have decided something in the same direction. The interpretation takes work; the presence of the pattern is the prompt to do that work.
Disclosure lag approaching the 45-day cap. Senators who file near the statutory cap are more likely to be filing strategically than senators who file within a week. There is no legal obligation to file early; the STOCK Act gives 45 days. But late filings correlate, empirically, with trades that turn out to be more consequential. The mechanism is probably mundane (busy senators, staffing gaps) but the empirical correlation is there. I treat a lag > 40 days as a yellow flag for that specific disclosure.
What doesn't hold up
- Single-senator flow as a standalone signal. One senator buying one stock is noise. You need aggregation, across senators, across time, across committees, to get information out of the disclosures.
- Party-homogeneous flow without committee overlap. Four Republican senators buying a stock that has no particular relevance to any of their committees is usually just correlated retail-style behavior, not an edge.
- Derivatives disclosures taken at face value. Many senator derivatives trades are written by money managers under limited authority; the senator didn't personally decide. The committee flag is less meaningful on these.
- Very small size-range disclosures. A $1,001–$15,000 trade from a senator with a $5M portfolio is rounding error. Filter by the upper end of the size range if you want the trades that are material to the senator.
Example: defense-prime flow in 2024–2025
Through 2024 I watched Senate disclosures on the major defense primes (LMT, RTX, GD, NOC). What stood out was not the aggregate direction, senators were net buyers across the sector, which tracked overall rising defense budgets, but the *specific committee concentration.* Senators on Armed Services and Intelligence were overrepresented on the buy side by roughly 2× their share of total Senate seats, while senators on Finance and HELP (Health, Education, Labor, Pensions) were underrepresented. That disproportion persisted for about fourteen months. The prime contractors outperformed S&P 500 by ~14% over the same period.
I do not claim the Senate flow *caused* the outperformance. The senators on the relevant committees were privy to budget-authorization timing and procurement news flow that was going to move the stocks regardless. The flow was a correlated signal, not an independent causal lever. But it was one more piece of evidence, early, that committee-informed people were positioning in the same direction. I want to know when that is happening.
Common mistakes
- Taking a single disclosure as a trade idea. Aggregation is the whole game. One trade is never the signal.
- Ignoring committee context. A senator's portfolio is not itself informative; the subset of their portfolio that overlaps their committee responsibility is.
- Over-weighting buys, under-weighting sells. Senator sells have roughly equal informational content to buys on the same committee overlap, but sells are systematically underreported in retail commentary.
- Treating options trades like equity trades. Size and information ratio are very different for option disclosures; interpret separately.
- Confusing STOCK Act disclosure with alpha generation. The disclosures are public. Anyone who wants them has them. Your edge, if any, is in how you aggregate and contextualize, not in access.
Where it fits
Pair with House Trades for the lower-chamber view, Congress Summary for the unified per-ticker roll-up across both chambers, and Congress Live Activity for the cross-ticker feed. The cross-ticker feed is where you notice clusters forming before they show up on any single name.
FAQ
Is trading on congressional disclosures legal?
Yes. The STOCK Act specifically requires public disclosure precisely so that non-insiders can be on equal footing. The ethical question, whether senators should be allowed to trade individual stocks while in office, is a policy debate that hasn't yet changed the law.
How fast is the data?
Disclosures typically hit the official feeds within 1–3 days of filing. Our ingestion polls the House Clerk and Senate Financial Disclosure databases every few hours during U.S. business hours. So the latency is dominated by the filing lag, not our pipeline.
What about family-member trades?
Spouse and dependent trades are disclosed under the same rules and tagged as such on the card. These carry somewhat lower signal content than senator-direct trades on average but still deserve the committee-overlap test.
Can I set up alerts for specific senators or committees?
Yes, the Trade Alerts surface supports alert rules filtered by party, committee, and size range. I use a rule that fires on any Armed Services or Intelligence senator buying a name I hold or watch.
How do I know if a senator's committee is relevant to a ticker?
The card auto-flags ticker-to-committee relevance based on GICS sector mapping and our own committee-jurisdiction registry. The flag is a heuristic, not a guarantee, edge cases (holding companies, conglomerates, or sector-spanning tickers) may need a human sanity check.
Related reading
- Congress House Trades
- Congress Diff Quarterly Snapshot
- Congress Live Activity Feed
- Congress Trades per Ticker
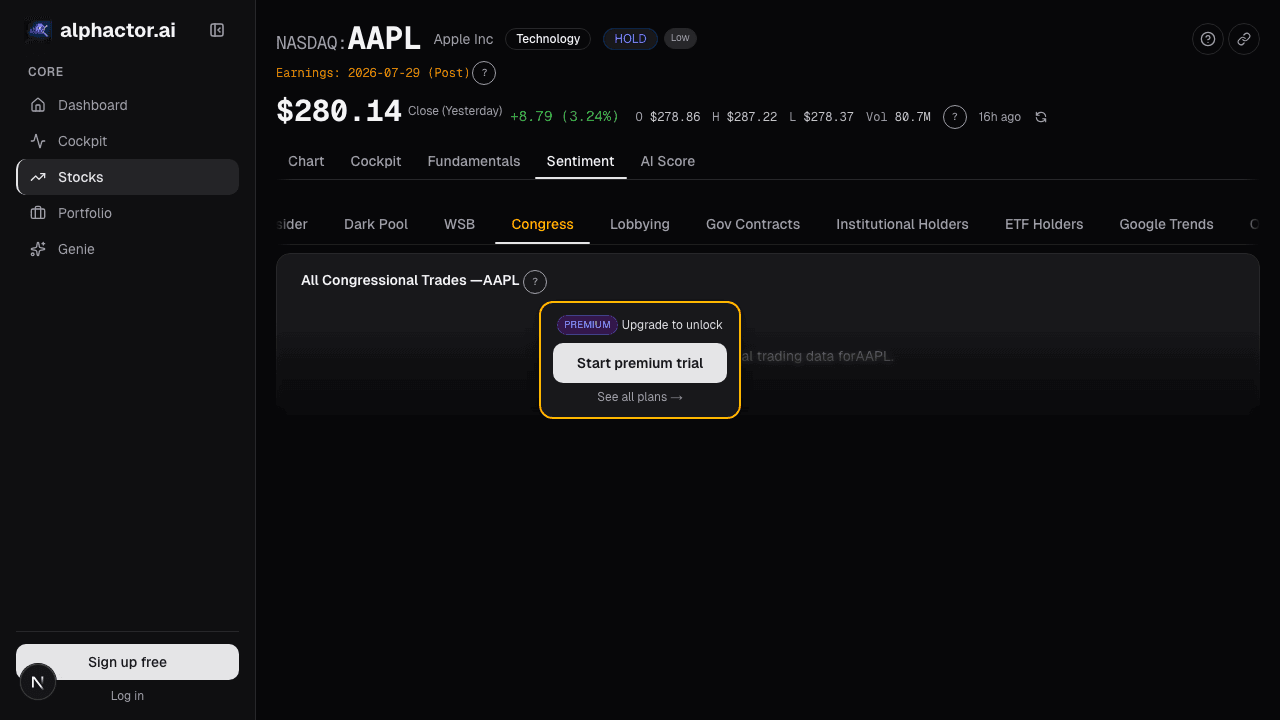
Open the Senate Trades card → /app/stocks/AAPL/sentiment
See it in the app
Live dashboard views that match this post. Each tile deep-links to the exact card.
Stocks mentioned
Related reading
Congress Diff: What Legislators Bought and Sold This Quarter
One senator's $50k buy isn't a thesis. Thirty members of Congress netting positive in Big Tech while netting negative in regional banks is, because the…
House Trades: Per-Ticker Flow From the Lower Chamber
Representatives trade under the STOCK Act like senators, but House flow has a different character, shorter terms, narrower districts, and more industry…
Congress Live Activity: Legislator Trades in Near-Real-Time
Congress Live Activity aggregates STOCK Act filings with jurisdictional flags and cluster alerts, turning scattered PDFs into a scannable daily signal.
Congressional Trades on a Single Stock
The 'Congress outperforms the market' story hides where the actual signal is. It's not aggregate Congressional portfolios, it's a single committee chair's…
How to Track Congressional Stock Trades (And Why You Should)
How to use Alphactor's congressional trade tracker to monitor stock transactions disclosed by US lawmakers and incorporate them into your research.
Ready to try alphactor.ai?
Validate your trading strategies with statistical credibility testing. Start free.
Get Started Free