Leaderboards and Social Profiles
How Alphactor's leaderboards rank users by verified strategy performance, and how social profiles help you find traders worth following.
 Marcus Chen4 min read
Performance Transparency Changes Everything
On most trading platforms, the loudest voices get the most attention. Someone posts a screenshot of a winning trade, claims a 200% return, and collects followers. What you never see is their full track record, their losing trades, or whether the winning strategy was backtested or just lucky.
Alphactor's leaderboard takes a different approach. Rankings are based on verified strategy performance, calculated from actual backtest results on the platform, not self-reported numbers.
When you see a user ranked first by Sharpe Ratio, that ranking reflects strategies they built, tested, and published on Alphactor, with every metric independently calculated.
How the Leaderboard Works
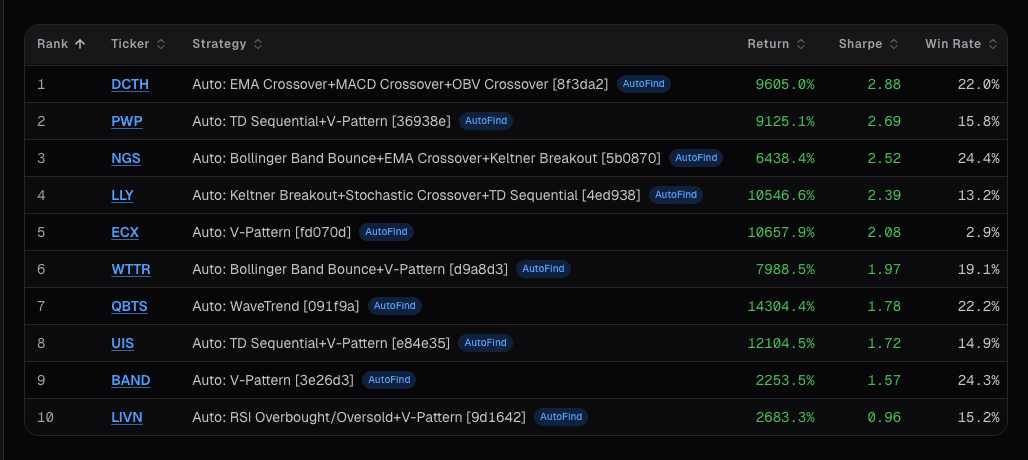
The Leaderboard page displays ranked users with their aggregated performance metrics: Total Return, Sharpe Ratio, Win Rate, Maximum Drawdown, and the number of strategies they manage. You can sort by any of these metrics and filter by time period: 30 days, 90 days, 1 year, or all time.
Sorting by Sharpe Ratio surfaces users who generate the best risk-adjusted returns. Sorting by Total Return shows the highest absolute performers. Sorting by Win Rate highlights consistency. Each view tells a different story, and the best performers tend to rank well across multiple metrics.
The time period filter is important because short-term performance can be misleading. A user who ranked first over 30 days might have caught one aggressive trade. A user who has maintained a top-10 position over a full year is demonstrating sustained skill, not luck.
Users who have verified their accounts display a Verified badge next to their name, adding an additional layer of trust.
Reading a Social Profile
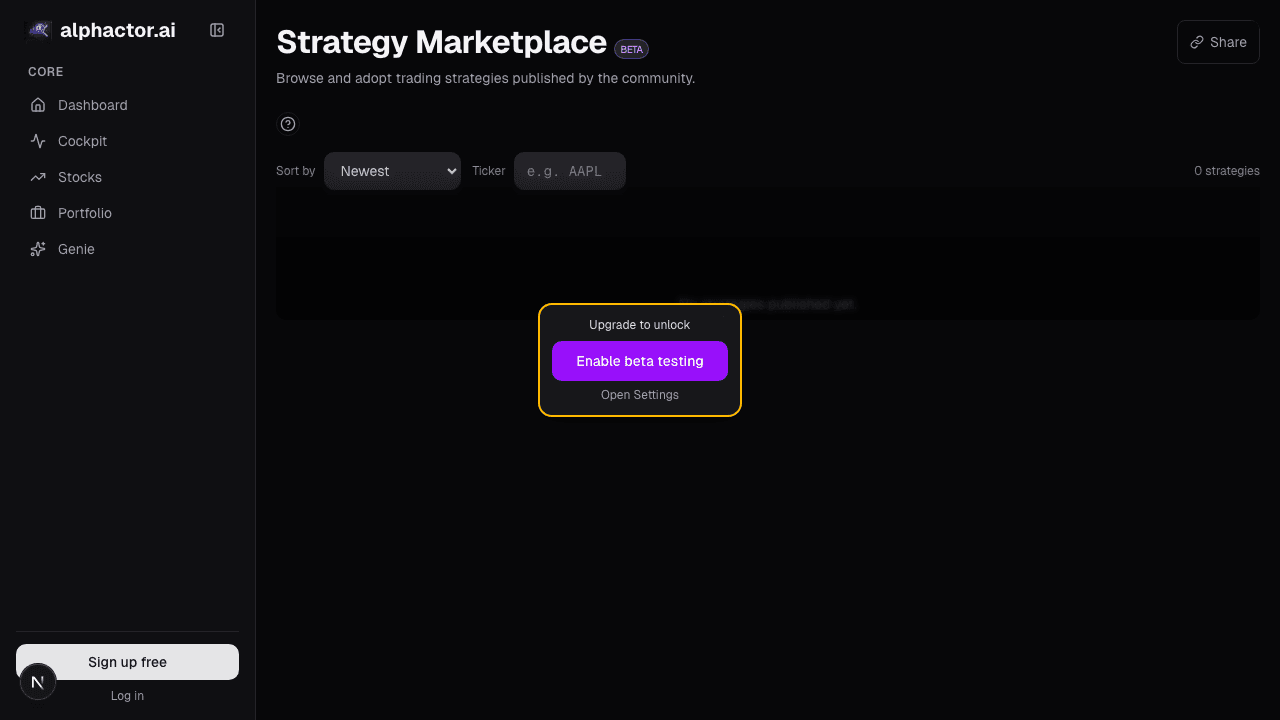
Each user on the Leaderboard has a public profile page. Clicking their name takes you to a view that shows their published strategies, performance history, and community ratings. This is where you move from "who is performing well" to "can I learn from their approach."
A user's profile shows every strategy they have published to the strategy marketplace, along with its ticker, performance metrics, credibility tier, adoption count, and average rating. If a user has published 8 strategies across different tickers and 6 of them have High credibility ratings, that tells you something about their methodology. They are not one-hit wonders. They have a repeatable process.
Reviews from users who adopted their strategies add qualitative context. You might read that a particular strategy works best during trending markets but gives back gains in consolidation. That insight helps you decide whether the strategy fits your trading style before you adopt it.
Three Ways to Use the Leaderboard
Find strategies to adopt. This is the most direct use. Sort the Leaderboard by Sharpe Ratio over the last year, identify the top performers, and click through to their profiles. Browse their published strategies, evaluate the metrics, and adopt the ones that align with your approach. You are starting from a proven foundation rather than building from scratch.
Benchmark your own performance. After running strategies on Alphactor for a few months, check where you would fall on the Leaderboard. If your best strategy has a 1.2 Sharpe and the top performers are consistently above 1.8, you have a concrete target to work toward. The Leaderboard turns vague goals like "get better at trading" into measurable benchmarks.
Study methodology patterns. Look at what the top 10 users have in common. Do they tend to focus on specific sectors? Do they prefer momentum or mean reversion strategies? Do their strategies have many parameters or few? Over time, you will notice patterns in how successful users approach strategy construction. Those patterns are more valuable than any single strategy.
The Incentive Structure
Publishing strategies and appearing on the Leaderboard is voluntary. Users who choose to share are rewarded with visibility: high-performing strategies attract adoptions, ratings, and profile views. This creates a positive selection effect where users with genuine skill are motivated to share, and users without it have no incentive to publish mediocre results.
The rating system provides accountability. If a user publishes a strategy that looks good on backtest metrics but disappoints adopters, the ratings will reflect that. A 2-star average rating next to a high Sharpe ratio tells you the backtest numbers may not be translating to real-world satisfaction. Conversely, a 4.5-star average with strong metrics indicates both quantitative and qualitative validation.
Leaderboard vs. Social Media Trading Communities
The difference between Alphactor's Leaderboard and a trading community on social media comes down to verifiability. On social media, anyone can claim any return. On Alphactor, every metric is calculated from strategy data on the platform. Past performance does not guarantee future results, but it does mean you are making decisions based on real data rather than unverifiable claims.
Getting Started
You do not need to publish strategies to use the Leaderboard. Browse it as a read-only resource to find strategies worth adopting and users worth studying. As you build and test your own strategies on Alphactor, you may reach a point where your results are worth sharing. At that point, publishing is a one-click action from your strategy page.
The Leaderboard resets its time-period calculations continuously, so performance is always current. A user who was ranked first six months ago but has underperformed since will have dropped in the rankings. What you see is always the current state of play.
See it in the app
Live dashboard views that match this post. Each tile deep-links to the exact card.


Related reading
Cockpit Cards: Quick-Glance Intelligence per Stock
How cockpit cards surface the signals, events, and changes that matter most across your watchlist and portfolio without information overload.
Free vs Pro: Which Plan Fits Your Trading Style?
A practical comparison of Alphactor's Free, Pro, and Premium plans to help you pick the right tier for your trading and analysis workflow.
Alphactor on Mobile: Full Analysis Power in Your Pocket
How Alphactor's mobile experience delivers portfolio monitoring, strategy signals, alerts, and stock analysis from your phone.
Regime-Aware Strategy Selection
Markets cycle through trends, ranges, and shocks. Learn how regime detection drives which strategy runs, and why a mixture of experts beats a single static…
WallStreetBets Mention History
WSB mention spikes predict volatility but not direction. The Z-score is the usable metric; confirmation from insider or options data is required before acting.
Ready to try alphactor.ai?
Validate your trading strategies with statistical credibility testing. Start free.
Get Started Free