Gamma Exposure (GEX): How Dealer Hedging Shapes Every Move
Positive vs negative gamma regimes change how the market reacts to shocks. Same tape, same headline, the path depends on whether dealers are damping moves…
 Jake Morrison7 min read
Early March 2020 I watched the S&P open down 4%, rally back to flat by mid-morning, then collapse to -7% in 90 minutes to trigger the circuit breaker. The move didn't make sense as a reaction to new information, there wasn't much new information between 11am and 1pm. It made complete sense as a dealer hedging phenomenon: dealer gamma flipped deeply negative that morning as the S&P broke below the concentration of put strikes, and every further 1% down forced dealers to sell another ~$3B of index futures to maintain delta neutrality, which drove another 1% down, in a mechanical loop. Nobody pressed sell buttons because of news. The market sold itself because of how positioning was stacked. If you'd been reading dealer gamma in the days prior, the sign flip was visible and the path risk was quantifiable. Without that lens, the day was confusing; with it, it was mostly mechanical.
This post is about the GEX Summary card, the practical difference between positive-gamma and negative-gamma regimes, and why the zero-gamma level matters more than the magnitude of GEX itself.
TL;DR
- GEX is the aggregate dollar change in dealer delta per 1% move in the underlying. Summed across the whole chain.
- Sign matters more than magnitude. Positive GEX = dealers damp moves. Negative GEX = dealers amplify.
- The zero-gamma flip level is a regime boundary, not a price target. Spot near flip = discontinuous volatility.
- Strike concentration is where the action happens. Large OI at a strike creates a gamma "wall" that pins price.
- Use GEX to choose structures, not to take directional bets. Premium-selling in positive gamma, long-vol in negative.
What GEX actually measures
Gamma exposure is the aggregate dollar change in dealer delta per 1% move in the underlying, summed across the entire options chain. Dealers (market makers) are the counterparty to most retail and institutional option flow; when retail buys calls, dealers are short calls and must hedge by buying the underlying. As price moves, the hedge ratio changes, that's gamma, and dealers must rebalance continuously.
The sign matters more than the magnitude. Positive GEX means dealers are net long gamma: they sell into rallies (because their delta gets longer as the underlying rises) and buy into dips (because their delta gets shorter as the underlying falls), damping realized volatility. Negative GEX means dealers are net short gamma: they sell into dips (because they're getting shorter delta on the way down) and buy into rallies, amplifying moves in both directions. Same headline, same tape, completely different path the market takes to price it in depending on the regime.
This isn't an edge-case phenomenon. SPX dealer gamma flips sign multiple times per month in normal market conditions and dominates intraday volatility behavior on expiry and near round-strike concentrations.
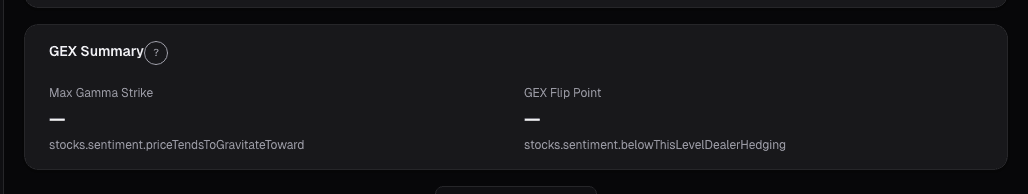
What the GEX Summary shows
The GEX Summary card reports:
- Total GEX in dollars per 1% move, aggregated across all strikes and expiries
- Sign indicator highlighted in green (positive, damping) or red (negative, amplifying)
- Zero-gamma flip level: the spot price at which net dealer gamma crosses zero
- Distance from spot to flip: how far a move needs to travel to change regime
- GEX by strike distribution: a histogram showing where gamma concentrates; clusters near round strikes or prior resistance/support levels are common pinning zones
- GEX by expiry: which expirations are driving the aggregate; short-dated expiries contribute more to daily realized-vol behavior than monthly or LEAPS
- Historical GEX trajectory: 30-day series of total GEX so you can see whether today's level is typical or extreme
Reading the regime
Positive GEX + spot well above flip. Low-vol, mean-reverting tape. Realized volatility compresses. Premium-selling structures (iron condors, credit spreads, covered-call overwriting) fit the environment. Directional calls for continuation of the trend are harder because the damping keeps cutting into the upside. This is the "dull summer afternoon" regime that persists for weeks at a time in normal markets.
Negative GEX + spot well below flip. Trending, volatile tape. Realized volatility expands, and moves in either direction tend to amplify through the session. Premium-buying (long straddles, long calls in a downtrend rally) or long-vol exposure (VIX calls, VIX ETN longs) fits. Premium-selling structures, particularly naked short strangles or iron condors, can break in a single session because realized vol exceeds what the implied-vol pricing at strike assumed. This is the "stairs up, elevator down" regime.
Spot sitting near the flip level. The most dangerous configuration. Small moves flip the regime, realized vol becomes discontinuous, and short-gamma structures can break abruptly when the flip occurs. The zero-gamma level is not a price target, it's a volatility-regime boundary, and being near it is a reason to reduce gamma-risk exposure rather than to take a directional bet.
Strike-concentration pinning. When a single strike holds a large share of open interest, that strike becomes a gamma wall: dealer hedging flow near the strike pulls price toward it (positive gamma) or pushes it through (negative gamma) depending on sign. On monthly expiry days, SPX often pins at a strike with massive OI, the GEX-by-strike chart shows you which strike to watch.
Example: an SPX pin into expiry
Third Friday of June 2024, monthly SPX expiry. Going into the session:
- SPX ~5450
- Zero-gamma flip: 5420
- Total GEX: +$8B (damping regime)
- Massive call OI at 5450 strike: ~450,000 contracts
- Call OI at 5475: ~180,000
- Put OI at 5400: ~220,000
The picture: positive-gamma regime, dealers long gamma at 5450 meant they were structurally selling any rally above 5450 and buying any dip toward 5440. Net effect: price would pin within a narrow range around 5450 as the strike expired. Intraday: SPX opened at 5448, spent the entire session in a 5447-5453 band, closed at 5450.25. The 5450 strike expired maximum value for the call holders who sold them, minimum intrinsic value for the buyers, which is usually how OPEX friday plays out when a strike holds a large GEX concentration. Positioning around this with long-vol or short-gamma structures would have bled premium for nothing; the regime was unambiguous in the data.
What GEX doesn't tell you
- Direction. GEX is about volatility behavior, not direction. A negative-GEX tape can trend up or down; GEX tells you the path will be chaotic either way.
- Events not in the options chain. Unexpected macro news (Fed surprise, geopolitical shock) overwhelms dealer positioning mechanics.
- Retail vs. institutional GEX breakdown. The aggregate measure is blind to whether dealers are long gamma because of retail put-buying (retail pays premium) or institutional call-selling (institutions receive premium). The implications for interpretation differ.
- Exact magnitude of moves. GEX tells you the regime and direction of dealer hedging, but the realized move size depends on macro flow, volume, and whether other participants step in to absorb or join the dealer hedging.
Common mistakes
- Trading GEX as a directional signal. It isn't. It's a vol-regime signal and a structure-selection signal.
- Ignoring the flip level. Spot 30 handles below flip and moving away is a different trade than spot 5 handles above flip and drifting down.
- Using single-ticker GEX without index context. Single-name dealer gamma matters less than index gamma for tech mega-caps correlated to SPX behavior.
- Treating high absolute GEX as more important than sign. A small positive GEX is a damping regime too. The sign defines the regime.
- Overreacting to GEX in a single session. GEX regimes persist for days-to-weeks; daily noise in the measure is smaller than regime changes.
Where it fits
GEX is the top of the options-context stack. Combine with Open Interest to locate the walls where gamma concentrates, and with Options Key Metrics for implied vs. realized-vol context. On the macro side, the Universe GEX view shows regime-level dealer positioning across the S&P, which often moves before individual-name GEX does.
FAQ
How often does GEX update?
Real-time during market hours using the live options chain. Historical series stores daily closes.
Is GEX a leading or lagging indicator?
It's neither, it's a concurrent measure of the current dealer-positioning regime. It doesn't predict what will happen; it describes the mechanical environment in which things happen.
How does GEX change around expiry?
OPEX days typically see large GEX shifts as expiring contracts roll off. The near-term expiry contribution to total GEX drops to zero as contracts settle, potentially flipping the sign if the expiring piece was large.
Does GEX work on single stocks or only indices?
Both, but it matters most on indices and heavily-optioned mega-cap names where dealer hedging volumes are large relative to natural underlying liquidity. For a thinly-optioned small-cap, GEX is small and rarely moves price meaningfully.
What's a "large" GEX?
Context-dependent. SPX typically runs ±$5–15B; multi-billion magnitudes are normal. Single names are a much smaller scale. Use the 30-day trajectory chart to see what's typical for the specific name.
Related reading
- Options IV Rank and Key Metrics
- Options Open Interest Magnets
- Unusual Options Activity Signals
- Options Market Signals
Open the GEX Summary card → /app/stocks/AAPL/sentiment
See it in the app
Live dashboard views that match this post. Each tile deep-links to the exact card.
Stocks mentioned
Related reading
IV Rank, IV Percentile, and Skew
IV rank, IV percentile, and 25-delta skew answer three different volatility questions. Together they drive trade structure, sell strangles, buy calls, or exit.
What the Options Market Tells You About Stock Direction
How to read implied volatility, put/call ratios, unusual activity, and gamma exposure to extract directional signals from the options market.
Open Interest Magnets
Pinning isn't mysticism, it's observable dealer hedging flow that drags spot toward concentrated-OI strikes into Friday close.
Unusual Options Activity
What qualifies as 'unusual' isn't raw volume, it's volume relative to open interest, aggressor side, and time-to-expiration.
Ready to try alphactor.ai?
Validate your trading strategies with statistical credibility testing. Start free.
Get Started Free