Unusual Options Activity
What qualifies as 'unusual' isn't raw volume, it's volume relative to open interest, aggressor side, and time-to-expiration.
 Jake Morrison7 min read
In May 2023 I was watching a mid-cap biotech ahead of a Phase 3 readout scheduled for the following month. The stock had been range-bound for weeks on average volume. Mid-session on a Tuesday, the unusual-activity feed flagged a single order of 4,200 contracts of the 30-day out-of-the-money calls, lifted entirely at the ask as a sweep across three exchanges within 80 milliseconds. Open interest on that strike prior to the sweep was 1,100; the order more than tripled the strike's OI in one trade. The premium paid was roughly $1.2M. That is not a retail trade, not a hedge (no corresponding equity position change showed up in the next flow window), and not a position roll (no offsetting sell on any nearby strike). My read was that someone with a view on the readout was buying directional exposure, expensive enough that it had to be informed. I took a small long-call position at a less aggressive strike as a tag-along, sized to survive a wrong-call. Three weeks later the readout printed positive; the stock gapped 28% in a session; the lead buyer in the unusual activity was later reported to be a healthcare-specialist hedge fund. That's the archetypal pattern the card is built to surface. Most days the feed is noise; on the days it isn't, the signal is loud and early.
This post is about the Unusual Activity card, why volume relative to structure beats absolute volume as a filter, and the three filters that separate informed flow from noise.
TL;DR
- Raw volume is noise; volume/OI ratio is signal. A 3× OI trade is informed; a 0.3× OI trade is positioning churn.
- Sweeps at the ask = aggressive buyer. Mid-price or bid-side fills are ambiguous.
- Time-to-expiration > 14 days filters out day-trade lottery tickets. Short-dated gambling isn't a conviction signal.
- Pair with scheduled catalyst calendars. Unusual flow into known catalyst dates is more informative than flow with no reason.
- Follow-the-flow is not a standalone system. Size small, pair with fundamentals, and accept that informed flow is also wrong plenty.
What makes activity "unusual"
The common mistake is to sort option activity by raw contract volume and call the top of the list "unusual." That surfaces SPY and QQQ every day, which is meaningless, they're the most-liquid options in the world. What's actually informative is volume relative to the strike's own structure: open interest on that specific strike, the strike's 20-day average volume, and the broader chain context.
The composite of what counts as genuinely unusual:
- Volume > 3× open interest on that strike. A trade that tripled OI is not rebalancing; it's new directional exposure.
- Volume > 5× trailing-20-day mean on that strike. The strike isn't routinely traded at this size.
- Single block or fast sweep, not scattered odd-lot fills. Sweep orders executed across multiple exchanges within milliseconds indicate a buyer prioritizing speed of fill over price, a costly choice unless the buyer has a view.
- Aggressor side = ask (the buy-side badge). Mid-fills and bid-fills are ambiguous; lifted-at-ask is explicit conviction.
- Premium paid material in absolute terms. A $50,000 trade is noise; a $1M+ trade is a real actor.
- Time-to-expiration ≥ 14 days. Near-expiration exposure is often day-trade churn; longer-dated is structural.
A trade that clears all six bars simultaneously is rare. When one does surface on a name without an obvious catalyst, it's worth a second look.
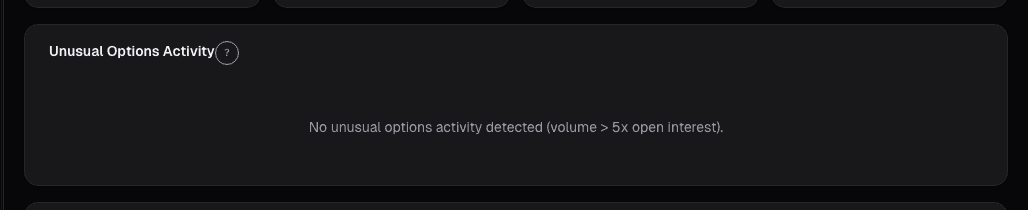
What the Unusual Activity card shows
The Unusual Activity card ranks the day's most out-of-pattern option trades by a composite score:
- Strike, expiration, direction (call/put) for each flagged trade
- Size relative to open interest: the primary filter
- Premium paid in dollars
- Aggressor side: BUY (lifted ask) vs. SELL (hit bid) vs. MID (ambiguous)
- Sweep flag: orders filled across multiple exchanges within milliseconds
- Time-to-expiration for context
- Deviation from 20-day mean volume: how far outside the strike's normal
- Catalyst-proximity indicator: does a known event (earnings, FDA, product launch) fall within the option's life?
- Aggregate flow for the day: net delta and net vega across all flagged flow
Three filters
Open-interest ratio ≥ 3×. Today's volume must be at least 3× the strike's outstanding OI for the trade to be interpreted as new directional exposure rather than position maintenance. Below 3×, the trade could easily be a roll, a hedge adjustment, or inventory rebalancing by market makers, none of which reflect an informed view. Above 3×, the new positioning is large enough that someone is taking a real view.
Aggressor side = ask. The BUY badge (trade printed at the offer) means a buyer was willing to pay the spread for immediate fill. That's a direct cost, the spread is the price of urgency, and actors don't pay it unless they have a reason to be in a hurry. Mid-price and bid-side trades are ambiguous: the counterparty might be a seller accepting the spread (also directional but inverted), or both sides might be neutral actors routing through the book.
Time-to-expiration > 14 days. Short-dated options are dominated by day-trade lottery tickets, meme-driven speculation, and expiry-week gamma hedging, all noise from an informed-flow perspective. Options with two weeks or more of life remaining are more likely to reflect genuine positioning; the buyer is paying a real premium, not a lottery-ticket-level payout.
A trade that clears all three filters on a mid-cap name without a scheduled catalyst is worth a real second look. On names with scheduled catalysts (earnings in 30 days, FDA decision in 45 days), the filter should be more selective, a lot of "unusual" flow into scheduled events is just retail front-running the event, not informed positioning.
Example: the May 2023 biotech
The flagged trade detail on the biotech before its Phase 3 readout:
| Field | Value |
|---|---|
| Ticker | (mid-cap biotech) |
| Strike | $18 Call |
| Expiration | 32 DTE |
| Volume | 4,200 contracts |
| Open interest (pre-trade) | 1,100 |
| Volume/OI | 3.8× |
| 20-day mean volume | 280 |
| Deviation | 15× mean |
| Aggressor | BUY (lifted ask) |
| Execution | Sweep across 3 exchanges, 80ms |
| Premium paid | $1.18M |
| Catalyst proximity | Phase 3 readout scheduled 27 DTE |
Every filter cleared: OI ratio 3.8×, mean deviation 15×, BUY at ask, sweep execution, substantial premium, catalyst within option life. I took a small long-call position at a slightly less aggressive strike, smaller size than the lead buyer, different strike to reduce correlation with the informed flow. The readout printed positive three weeks later, the stock gapped, and the position worked. The card didn't tell me what the fund knew; it told me someone with material capital had a strong directional view. That was enough to warrant a small tag-along.
What unusual activity can miss
- Hedging vs. speculation. A big block of puts might be a hedge against an existing long position (not a bearish bet); the card can't reliably tell the difference.
- Spread and multi-leg trades. Complex structures (calendars, verticals, butterflies) can show up as individual flagged trades without the full context of the broader structure.
- Dealer inventory. Market-maker inventory rebalancing can look unusual without being informative.
- Short-vol / covered-call sellers. Large call volume on long-held positions is often covered-call income generation, not bullish positioning.
- OCC-reporting lag. Very large trades may be reported with delay; same-day context can be incomplete.
Common mistakes
- Sorting by absolute volume. The top names are always the most-liquid; meaningless for signal.
- Ignoring the aggressor column. Mid-fills and bid-side trades are ambiguous; pretend they're not there.
- Chasing the same strike. The informed flow paid a specific premium at a specific strike; entering at a worse price after the news is already half-priced.
- Not checking catalyst proximity. Flow into an event is often just event-positioning; flow without a catalyst is more likely informed.
- Treating flow as a guaranteed win. Even informed flow is wrong 40% of the time. Size accordingly.
Where it fits
Unusual activity is an early-warning layer, not a standalone trigger. Pair with Options Key Metrics for IV rank and skew context, unusual flow when IV is already rich is different from unusual flow at low IV. Pair with Insider MSPR when the flow looks like it anticipates corporate action; insider buying + unusual call flow is a stronger combined signal than either alone. The feed also surfaces into Cockpit Trade Alerts so flow on names you already own bubbles up automatically.
FAQ
How fresh is the flow data?
Near-real-time intraday. Sweeps are flagged within seconds of the print; the composite ranking updates on each new flagged trade.
Does it cover index options?
Yes, SPX/SPY/NDX/QQQ are covered, but the filters default to higher thresholds because normal volume is already elevated.
Can I filter by call vs. put flow?
Yes, the direction filter lets you see bullish-only or bearish-only flow.
What about zero-day-to-expiration flow?
Filtered out by default (TTX > 14 days). Togglable for traders who specifically want 0DTE dynamics.
How reliable is the aggressor-side tag?
Based on the NBBO at trade time. Accurate for most prints; ambiguous for trades at the midpoint or during fast markets.
Related reading
Open the Unusual Activity card → /app/stocks/AAPL/sentiment
See it in the app
Live dashboard views that match this post. Each tile deep-links to the exact card.
Stocks mentioned
Related reading
Congressional Trades on a Single Stock
The 'Congress outperforms the market' story hides where the actual signal is. It's not aggregate Congressional portfolios, it's a single committee chair's…
Corporate Lobbying Disclosures
Lobbying spend publicly discloses which regulatory fights a company is fighting. A quarter-over-quarter jump in contacts to a new agency often precedes the…
Dark Pool Prints
Off-exchange share above 45% clustered into weakness signals institutional accumulation. Dark pool prints are regulated, post-trade transparent, and measurable.
Dashboard News: A Filtered Stream Across Your Holdings
Generic news feeds drown you in noise. The Dashboard News card filters by your holdings and ranks by sentiment impact: what's new, what matters, why.
Gamma Exposure (GEX): How Dealer Hedging Shapes Every Move
Positive vs negative gamma regimes change how the market reacts to shocks. Same tape, same headline, the path depends on whether dealers are damping moves…
IV Rank, IV Percentile, and Skew
IV rank, IV percentile, and 25-delta skew answer three different volatility questions. Together they drive trade structure, sell strangles, buy calls, or exit.
Ready to try alphactor.ai?
Validate your trading strategies with statistical credibility testing. Start free.
Get Started Free