Corporate Lobbying Disclosures
Lobbying spend publicly discloses which regulatory fights a company is fighting. A quarter-over-quarter jump in contacts to a new agency often precedes the…
 Marcus Chen7 min read
In Q2 2023 a mid-cap healthcare IT name I'd been following doubled its lobbying spend quarter-over-quarter, from around $280k to $570k, and the filings listed three new agency contacts that hadn't appeared in prior quarters: CMS, the HHS Office of the National Coordinator, and a specific subcommittee of the Energy and Commerce Committee. The company hadn't announced anything. The stock was flat. Eight weeks later CMS published a proposed rule on interoperability requirements that the company was unusually well-positioned to serve, and the stock ran 22% over the following quarter as analysts caught up. The lobbying filings had been public the entire time. Almost no one reads them. The Lobbying Disclosure Act database is among the most granular corporate disclosures in the U.S., and retail traders ignore it because the UX of sopr.senate.gov is stuck in 1998. That's the opportunity.
This post is about the Corporate Lobbying Spend card, what LDA filings actually contain, and the three patterns that turn quarterly lobbying disclosures into tradeable policy proxies.
TL;DR
- LDA filings disclose exactly who lobbied whom on what, with dollars attached. Public, quarterly, extremely granular.
- Spend jumps into new agencies are the highest-information deltas. A first-time FDA contact from a pharma is the whole signal.
- Cross-reference with Congress flow. Rising lobbying + rising legislator positioning in the same name = a high-conviction regulatory tailwind setup.
- New issue areas reveal which fights management thinks are existential. Entering a new issue area is a declaration that a regulatory risk is now priced.
- Spend decline signals the fight is over: bullish if they won, bearish if they gave up.
Why LDA filings are underused
Every lobbying firm registered under the Lobbying Disclosure Act must file quarterly reports listing who hired them, how much was spent, which specific bills and agencies were contacted, and which issue areas were covered. The reports are public, searchable, and filed on a roughly 20-day lag after quarter-end. The data is unusually good for US regulatory work, you can see the exact subcommittees contacted, the exact bill numbers, and the dollar flow associated with each engagement.
Retail attention is nearly zero. The LDA database has no screener, no APIs polished for consumer use, and filings are formatted for lawyers rather than traders. The few institutional desks that mine this data systematically (some quant shops, some policy-focused L/S funds) have been running on it for years. For a retail trader willing to read eight-quarter-trailing summaries, the information asymmetry is durable because the input data is unchanged and the inattention persists.
Lobbying disclosures are especially valuable in sectors where regulation drives returns: healthcare, defense, finance, energy, telecom, and increasingly tech. In these sectors, a regulatory tailwind or headwind can swamp multiple quarters of earnings variance.
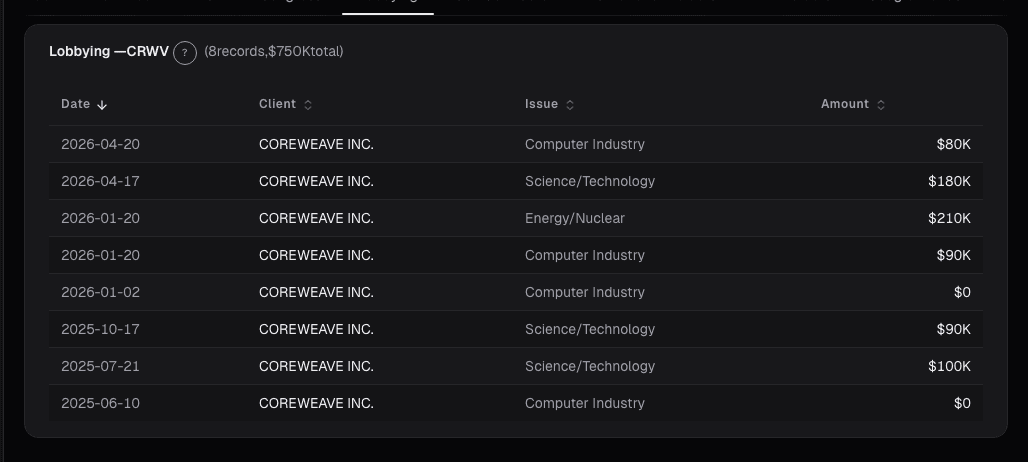
What the Lobbying Spend card shows
The Lobbying card aggregates the last 8 quarters of LDA filings for the issuer and its material subsidiaries:
- Total quarterly spend with QoQ change, YoY change, and a trailing 8-quarter trend line
- Lobbying firms engaged: which external firms the company hires, and any changes in roster
- Bill numbers cited: specific legislation the company is lobbying on
- Issue areas: regulatory categories (health policy, trade, financial services, etc.) with a new-issue-area flag highlighted
- Agencies contacted: which federal agencies the lobbying touched
- Sector-relative percentile: whether this issuer is in the 80th, 50th, or 20th percentile of lobbying spend for peers
The card flags *new* issue areas or agencies versus the prior 4 quarters separately, because those are the most information-rich deltas.
Three patterns
Sudden spend jumps into a specific agency. A 2× QoQ increase in a single agency's contact line from a pharma (say, FDA contacts doubling) typically precedes a filing decision, label expansion, or enforcement response within 1-2 quarters. The reasoning: the company is paying for access because something material is at stake. Agencies don't get paid-for-access for nothing. These jumps are unusually reliable when the target agency has direct jurisdiction over the company's core product.
Brand-new issue areas. The first time a company reports lobbying on, for example, "data privacy" or "AI governance" or "supply chain security," they've identified a regulatory risk worth paying to influence. The stock has often not yet priced that risk asymmetrically. The position can be long (betting the company will successfully shape the regulation) or short (betting the regulation will happen anyway and the company's disclosure of the risk is the tell). Either way the new-issue-area entry is high-information.
Spend decline on a formerly hot issue. Falling spend on an issue area that was elevated for several quarters can mean the fight is over. If the company won (the regulation moved their direction), it's bullish. If they gave up (the regulation is going to pass against them), it's bearish. The drop alone is ambiguous, pair it with the regulatory outcome to disambiguate.
Example: Q2 2023 healthcare IT
The filings summary for the company I flagged in the intro:
| Quarter | Total spend | Firms engaged | Bills cited | New issue areas | New agencies |
|---|---|---|---|---|---|
| Q2 2022 | $240k | 2 | 3 | , | , |
| Q3 2022 | $260k | 2 | 3 | , | , |
| Q4 2022 | $290k | 2 | 4 | , | , |
| Q1 2023 | $280k | 2 | 4 | , | , |
| Q2 2023 | $570k | 4 | 8 | "Interoperability" | CMS, ONC, E&C subcmte |
The step-function change in Q2, spend doubling, firm count doubling, a new issue area, three new agency contacts, was a declaration that the company had identified an imminent regulatory fight. Eight weeks later CMS published the proposed interoperability rule. The stock ran 22% in the following quarter. A trader watching the LDA feed had a 6-8 week head start on the consensus view.
What the card can miss
- Strategic non-disclosure. LDA filings capture registered lobbying; strategic communications that don't trigger the LDA reporting threshold won't show up. Dark money and 501(c)(4) activity is opaque here.
- State-level activity. Federal LDA only captures federal lobbying. State-level regulatory fights (critical in energy, insurance, healthcare) require separate state-by-state databases.
- International regulatory risk. The card is US-only. EU regulatory engagement (increasingly important for tech names) isn't captured.
- Timing of outcomes. Lobbying signals that an issue matters; it doesn't tell you when the regulation lands or which side wins.
- Company size effects. Large-caps lobby continuously on many issues; deltas matter less for them. Small- and mid-caps that suddenly appear in LDA filings are much higher-information.
Common mistakes
- Ignoring the industry baseline. A defense company spending $2M/quarter on lobbying is normal; a fintech startup doing the same is extraordinary. The percentile rank on the card is there for this reason.
- Over-reading small deltas. Quarter-to-quarter volatility of ±20% in lobbying spend is noise for established filers. Focus on 2×-or-more deltas and new-category entries.
- Reading lobbying as directional on its own. Without the policy context (which direction is the regulation heading?), lobbying is just evidence of engagement. Pair it with the actual regulatory narrative.
- Trusting the dollar amount as precise. LDA filings allow ranges and rounding; the reported numbers are approximate.
- Missing the firm roster. The external firms hired matter, hiring a former agency chief's firm tells you the company thinks agency access is the bottleneck.
Where it fits
Lobbying pairs naturally with Gov Contracts (actual federal dollar flow to the issuer), Congress trades (whether legislators are positioned in the name), and the quarterly Congress Diff view at the sector level. When lobbying spend is rising, contracts are rising, and Congress flow is rising in the same name, you have three independent policy-proxy signals aligning, that rarely happens by chance. For the macro context on which regulatory areas are heating up, check the sector aggregates on Universe Trends.
FAQ
How fresh is the lobbying data?
Quarterly filings are due 20 days after the close of each quarter. The card updates within 48 hours of the filing window closing.
Does lobbying spend correlate with stock performance?
Weakly on its own. The academic literature is split on whether lobbying creates shareholder value directly. What works is using lobbying as a *leading indicator* of regulatory events, not as a standalone factor.
Can I alert on new-agency contacts?
Yes, Trade Alerts supports lobbying-change alerts (new agencies, new issue areas, spend spikes) for watchlist names.
Are contract lobbyists and in-house lobbying both captured?
Yes, the LDA covers both when they cross the reporting threshold. The card aggregates them.
What about Super PAC spending?
Separate reporting regime (FEC, not LDA). Not included on this card; I recommend cross-referencing the FEC database for campaign-finance tracking.
Related reading
Open the Lobbying card → /app/stocks/CRWV/sentiment
See it in the app
Live dashboard views that match this post. Each tile deep-links to the exact card.
Stocks mentioned
Related reading
Congressional Trades on a Single Stock
The 'Congress outperforms the market' story hides where the actual signal is. It's not aggregate Congressional portfolios, it's a single committee chair's…
Dark Pool Prints
Off-exchange share above 45% clustered into weakness signals institutional accumulation. Dark pool prints are regulated, post-trade transparent, and measurable.
Dashboard News: A Filtered Stream Across Your Holdings
Generic news feeds drown you in noise. The Dashboard News card filters by your holdings and ranks by sentiment impact: what's new, what matters, why.
ETF Holdings: How Passive Flows Shape a Stock's Path
For large-cap US equities, 20-40% of shares outstanding sit inside ETFs that trade mechanically on creation/redemption, not fundamentals.
Google Trends Interest Over Time
Search interest in a brand, product, or ticker often precedes revenue by weeks. Used correctly, same-week year-over-year comparisons, not absolute levels …
Rising Queries: The Narrative Shift Detector
Rising queries catch narrative inflection before it is priced. Breakout searches growing over 5000% in a week signal product launches or incidents days early.
Ready to try alphactor.ai?
Validate your trading strategies with statistical credibility testing. Start free.
Get Started Free