Google Trends Interest Over Time
Search interest in a brand, product, or ticker often precedes revenue by weeks. Used correctly, same-week year-over-year comparisons, not absolute levels …
 Marcus Chen7 min read
In late August 2023 I was tracking a mid-cap specialty retailer into its September earnings print. The stock was drifting around the 200-day MA, analyst expectations were for roughly flat YoY revenue, and options flow was unremarkable. But Google Trends interest in the brand's three most-searched product lines was running 19-24% above the same week of the prior year, consistently, for seven straight weeks. That kind of sustained YoY step-up in search interest, specific to product terms rather than the company name, is a demand signal that typically precedes a quarterly beat for consumer-facing businesses by 3-6 weeks. I took a small long position 10 days before the print. Earnings came in 8% above consensus on revenue; stock gapped up 14% the following morning. The trend data had been public the entire time. The mistake most traders make with Google Trends is reading absolute levels, the tradeable signal is *same-week YoY*, because absolute volume drifts with Google's user base and seasonality dominates any multi-month comparison.
This post is about the Interest-Over-Time card, why same-week YoY is the usable metric, and the three patterns that make trend data a viable input for short-horizon revenue bets.
TL;DR
- Search volume leads revenue for consumer-facing businesses by 1-6 weeks depending on purchase-cycle length.
- Same-week YoY is the only comparison that matters. Absolute levels drift with Google's user base; MoM is dominated by seasonality.
- YoY step-up with flat stock is the beat setup. YoY step-down with rising stock is the fade setup.
- Product-term trends beat brand-name trends. Product searches capture actual purchase intent; brand-name searches capture news/curiosity.
- The signal is reliable for retail, travel, autos, restaurants, consumer software. It's weak or inverted for B2B and financials.
Why search interest leads revenue
Search volume for a brand, product, or service reflects consumer intent days-to-weeks before the transaction that eventually shows up in revenue. For consumer-facing businesses, retail, travel, autos, restaurants, consumer software with free trials, the correlation between query trends and reported revenue is strong enough that multiple systematic funds run on little else as a short-horizon signal.
Google Trends normalizes query volumes to a 0-100 scale per region and time window, which makes values directly comparable across years even when the absolute number of Google users is growing. That normalization is what makes YoY comparison tractable. You can't meaningfully compare a raw search count from 2020 to 2024 because Google's user base changed; the normalized 0-100 index corrects for that.
The failure mode is comparing absolute levels across long windows (meaningless, normalization discards the levels), or comparing month-over-month (dominated by seasonality for most consumer categories). The tradeable comparison is same-week YoY: is this week's normalized search interest running materially above or below the same week in the prior year?
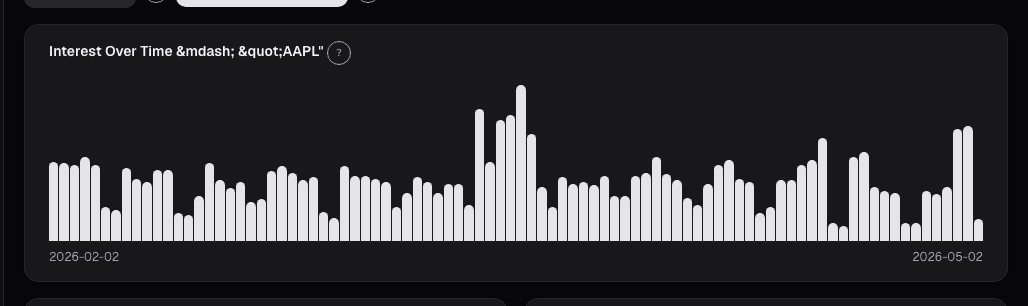
What the Interest-Over-Time card shows
The Trends Interest-Over-Time card plots daily normalized search interest for a curated set of terms associated with the issuer:
- Brand terms: company name, ticker, primary consumer-facing brands
- Product terms: flagship SKUs, product lines, service categories
- Trailing 24 months of data with a year-over-year overlay for visual comparison
- YoY step line: the key chart, showing this-week-YoY delta as a percentage
- 52-week trend regression highlighting whether the current level is above or below trend
- Earnings-date markers: prior earnings dates overlaid on the chart for lead/lag inspection
- Region drill-down: per-country interest for geographically diversified issuers
Three patterns that trade
YoY step-up into earnings, flat stock. Search interest running 15%+ above prior-year for the same week, sustained across 4+ weeks, combined with a flat or declining stock, this setup is the beat signal. Most reliable for retail, consumer staples, and specialty retailers where the query-to-transaction lag is short. The pattern says: consumer demand is running hot, the market hasn't priced it in yet, earnings will surprise up.
YoY step-down, rising stock. Interest running 15%+ below prior-year, same week, while the stock is near 52-week highs on analyst upgrades or sentiment. This is the fade setup, especially into an earnings print. The stock has been lifted on narrative; the underlying demand has been weakening; the narrative is about to collide with the data.
Brand vs. product divergence. Brand-name search interest rising while product-name search interest falls, usually negative for consumer companies. It signals that the brand is in the news (for any reason, often not good) without translating into purchase intent. The inverse, product interest rising while brand noise is flat, is clean demand acceleration.
Example: August-September 2023 specialty retail
The Interest-Over-Time data for the company in the intro:
| Week ending | Brand term (normalized) | Top product term | Product YoY delta |
|---|---|---|---|
| Jun 11, 2023 | 64 | 58 | +6% |
| Jul 9, 2023 | 67 | 65 | +12% |
| Aug 6, 2023 | 71 | 70 | +19% |
| Aug 27, 2023 | 74 | 74 | +22% |
| Sep 3, 2023 | 72 | 73 | +21% |
| Sep 17, 2023 | 76 | 78 | +24% |
Seven straight weeks of product-term YoY deltas in the +19 to +24 range. The step-up started in July and held into September. Earnings were reported September 28; revenue came in 8% above consensus. The stock gapped up 14%. The Trends data had foreshadowed the beat for 8 weeks before the print.
The specific lesson: I wasn't betting on the Trends data alone, I was betting on the *combination* of elevated product-term search, unchanged analyst consensus, and flat stock price. That combination is what creates the asymmetric payoff: the market has priced no surprise, the demand data says surprise is coming.
What Trends can miss
- B2B businesses. Software, enterprise services, and industrial goods don't get searched proportionally to demand; sales cycles are mediated by relationships, not search.
- Financial services. People don't Google "bank checking account" before opening one in any volume that correlates with revenue.
- Substitution risk. Rising searches for "running shoes" may not help the specific brand you're tracking if the rise is driven by a competitor's marketing campaign.
- News-driven query spikes. A product recall triggers search interest but is negative. Don't read every spike as bullish; read the direction alongside context.
- Regional mix. Search interest rising from low-LTV regions (emerging markets without the product available) isn't a revenue tailwind for the issuer.
Common mistakes
- Comparing absolute levels across years. The 0-100 normalization means absolute levels aren't comparable. Only same-window YoY comparisons work.
- Over-reading monthly changes. Seasonality dominates MoM; use YoY for any comparison longer than a week.
- Treating brand and product terms as interchangeable. Brand searches capture news; product searches capture demand. Use product terms for revenue prediction.
- Ignoring category cross-reads. A single-brand rise inside a falling category is often substitution; a single-brand rise with a rising category is share growth plus tailwind.
- Trading Trends data alone. Pair it with price action, estimate positioning, and sentiment for confirmation. Single-source Trends trades have lower hit rates.
Where it fits
Trends pairs well with Analyst Ratings (to spot where consensus hasn't caught up to demand) and Estimates (to see the revenue bar the market has set). For geographically diversified businesses, also check the Trends Regions card to see whether interest growth is coming from high-LTV or low-LTV regions. The Trends Rising Queries card surfaces specific new queries that are driving the step-up, often more informative than the aggregate Interest-Over-Time number.
FAQ
How fresh is the Trends data?
Daily, with a 24-48 hour lag. Google publishes daily interest indexes; the card pulls them nightly.
Which terms are tracked per ticker?
The card curates 8-12 terms per issuer: company name, ticker, 3-5 brand names, 3-5 product terms. The list is editable via the Watchlist settings for Premium users.
Does this work for crypto and ETFs?
For ETFs, weakly, flows are institutionally driven and don't correlate with retail search. For crypto, yes, retail search interest is a meaningful leading indicator for retail-driven names.
Can I screen on Trends YoY deltas?
Yes, the Screener supports Trends-based filters (product-term YoY > X%) with configurable lookback windows.
What about TikTok/Instagram/YouTube trends?
Not on this card. Those signals require separate data sources (Apptopia, social listening tools). For now, Google search trends are the most comprehensive cross-category demand proxy.
Related reading
- Google Trends Rising Queries
- Google Trends Top Queries
- Congress Trades per Ticker
- Corporate Lobbying Spend
Open the Interest-Over-Time card → /app/stocks/AAPL/sentiment
See it in the app
Live dashboard views that match this post. Each tile deep-links to the exact card.
Stocks mentioned
Related reading
Congressional Trades on a Single Stock
The 'Congress outperforms the market' story hides where the actual signal is. It's not aggregate Congressional portfolios, it's a single committee chair's…
Corporate Lobbying Disclosures
Lobbying spend publicly discloses which regulatory fights a company is fighting. A quarter-over-quarter jump in contacts to a new agency often precedes the…
ETF Holdings: How Passive Flows Shape a Stock's Path
For large-cap US equities, 20-40% of shares outstanding sit inside ETFs that trade mechanically on creation/redemption, not fundamentals.
Rising Queries: The Narrative Shift Detector
Rising queries catch narrative inflection before it is priced. Breakout searches growing over 5000% in a week signal product launches or incidents days early.
Top Related Queries
Top queries reveal narrative around a stock. Incident terms like lawsuit or breach in the top ten often surface days before mainstream financial media coverage.
Ready to try alphactor.ai?
Validate your trading strategies with statistical credibility testing. Start free.
Get Started Free