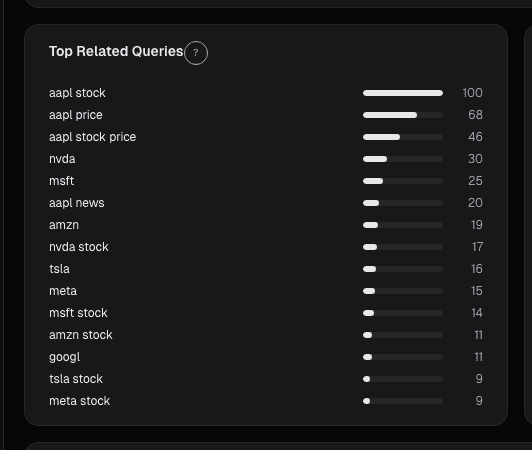
Top Related Queries
Top queries reveal narrative around a stock. Incident terms like lawsuit or breach in the top ten often surface days before mainstream financial media coverage.
 Marcus Chen6 min read
In September 2023 a mid-cap consumer tech name I was holding spiked +22% in search interest over five days. Going by the volume signal alone, I would've read that as bullish attention. When I pulled up the top queries, the picture was entirely different, six of the top ten queries were variants of "[brand] data breach" and "[brand] class action." The spike wasn't product launch attention; it was scandal attention. I trimmed the position that afternoon before the tape figured it out. Two weeks later the stock was down 15% on a formal FTC investigation disclosure that had been preceded by exactly the search pattern I'd read off the queries card. The volume number alone would have misled me. The query breakdown told the real story, and it did so with a week's lead time over the tape.
This post is about the Top Queries card, why the text of queries matters more than the count, and the three query classes that separate product demand from scandal noise.
TL;DR
- The volume view tells you how much; the queries view tells you what. Direction of attention matters.
- Product queries = structural demand. Stability in top set is a quality signal.
- Incident queries = red flag. "Lawsuit", "recall", "outage", "breach" appearing as top queries is usually bad news that isn't public yet.
- Competitive queries = multiple compression risk. "[Brand] vs [competitor]" often leads market share loss.
- Strip navigation queries ("[brand] login") out before reading. They're noise.
Top queries aren't about volume
The total volume view (interest over time) tells you *how much* people are searching for a name. The top queries view tells you *what* they're searching. The distinction matters because the what is where narrative lives. A spike in interest paired with top queries dominated by "[ticker] lawsuit" is a very different story than the same spike paired with "[ticker] earnings beat." The textual breakdown turns an anonymous volume chart into a readable summary of the conversation happening around the stock.
Search queries are revealed preference. When someone types "[brand] lawsuit" into Google, they either heard about a lawsuit and want details, or they're worried about one and are checking. Either way, the query is evidence that the topic is salient in the public conversation, typically before it reaches mainstream financial media. For retail-driven names, the top-queries view often leads mainstream news by days to weeks.
What the Top Queries card shows
The Top Queries card lists:
- 10–20 most common search queries that include the ticker or a canonical brand name, ranked by relative volume over the trailing 90 days
- Query text and relative volume score (0–100)
- "New" flag on queries that weren't in the top set a week ago, distinguishing stable Top-10 from one that has rotated in response to news
- Query category tag (product / incident / competitive / navigational / investment) assigned via a lightweight classifier trained on labeled finance queries
- Lexicon filter to strip out branded navigation queries ("[brand] login", "[brand] customer service") that don't carry narrative information
- Time-window toggle: 7-day, 30-day, 90-day, so you can compare short-term attention spikes to longer-term structural patterns
- Country breakdown: primary markets where the queries originate, which matters for international brands
Reading the signal
Product/service queries. "[Brand] pricing," "[brand] review," "[brand] alternatives," "[brand] subscription" in the top set are structural demand signals. Their stability over time is itself a quality measure, a name where product queries dominate consistently for years is one where the market has a clear understanding of what the company sells. Rotation in product queries (new products replacing old in the top set) is a healthy product-cycle signal.
Incident queries. "Brand] lawsuit," "[brand] recall," "[brand] outage," "[brand] breach," "[brand] investigation" appearing for the first time are red flags that need triage. Cross-check [News immediately, sometimes the incident is already public and already priced; sometimes it's still building. Incident queries tend to lead formal disclosures because regulators, affected parties, and employees start searching before the company releases a statement.
Competitive queries. "[Brand] vs [competitor]" are often the first signal that the market is starting to treat the competitor as an alternative, which compresses future multiples before revenue reflects it. A five-year chart where competitor names keep rotating into the top queries is a name whose customers are considering alternatives at rising rates. Not immediately bearish, but a slow-bleed multiple-compression driver.
Navigational queries. "[Brand] login," "[brand] customer service," "[brand] app" are navigation queries from existing customers. They correlate weakly with customer count but don't reflect narrative shift; strip them before reading top-10.
Example: a pre-announcement query shift
A mid-cap SaaS name I was watching in March 2024 had a clean queries profile for 18 months, product queries dominated, stable top-10. Over a 10-day window in March:
- New entries to top-10: "[brand] layoffs," "[brand] restructuring," "[brand] alternatives"
- Existing: product queries still present but dropping in relative rank
- Classifier flagged 3 incident-category queries that weren't there a month ago
The company hadn't announced anything. The searches were being driven by employees, affected customers, and rumor-adjacent media. A week later the company announced a 15% headcount reduction and guided full-year revenue down 6%. Stock dropped 18% the session after. The queries view had given a week's warning that *something* was going on; it didn't tell me exactly what, but it told me to reduce exposure before the formal disclosure. I trimmed to half the position based on the query shift; saved about 9% of my initial exposure.
What top queries can miss
- Pure institutional-flow events. If a name moves on a large hedge-fund rotation or a 13F disclosure, the search patterns won't reflect it, institutional action doesn't drive retail search behavior.
- Low-retail-interest names. Small-cap industrials, specialty chemicals, and similar names have thin search volume; top queries are noisy and the 0-100 relative scale is less meaningful.
- Queries that don't include the brand name. Crypto, broader-theme searches, and product-category queries that don't name the brand won't show up.
- International brand naming variants. A brand known by different names in different markets may have queries fragmented across variants; the card consolidates primary variants but edge cases slip through.
Common mistakes
- Reading query volume as positive attention. Direction matters, scandal queries produce volume spikes too.
- Ignoring the classifier tags. They're a useful first-pass filter; the incident-tag is where the highest-priority read-throughs are.
- Not stripping navigation queries. "[Brand] login" dominating the top-10 on a consumer SaaS is noise, not insight.
- Over-reading a single-week change. Query patterns fluctuate; use the 30-day or 90-day view for structural reads.
- Using this alone for a trade decision. Confirm with news, fundamentals, and other sentiment streams before sizing.
Where it fits
Use this card alongside Interest Over Time to answer the two halves of the same question: "how much" and "about what." For shorter-horizon, noisier retail attention, overlay with the WSB Mention History card, when both Google Trends and WSB spike on the same ticker the same week, attention is broad-based (bigger move potential, both ways). For leading-indicator reads of news flow, cross-check Rising Queries which shows the fastest-growing queries regardless of total volume.
FAQ
How often does the card update?
Queries update daily via Google Trends' public API. Category tagging re-runs weekly.
Are queries the same across countries?
No, Google Trends can be filtered by country, and queries reflect the country-specific search behavior. Our default is US for US-listed names; the breakdown shows the top countries if traffic is international.
How is the relative volume scored?
Google Trends normalizes query volumes to 0–100 within a time period, where 100 is peak volume. The scale doesn't represent absolute search counts (Google doesn't publish those).
Can I get alerts when an incident query enters the top-10?
Yes, Trade Alerts supports query-category alerts (fire when a new incident-category query enters top-10 for your watchlist tickers).
What about short-brand-name ambiguity (META vs. Meta Platforms vs. metaphysics)?
The classifier filters queries for disambiguation signal (ticker context, co-occurring finance terms). Some ambiguity remains for heavily-collided names; check the country and co-occurring query text.
Related reading
- Google Trends Rising Queries
- Google Trends Interest Over Time
- Congress Trades per Ticker
- Corporate Lobbying Spend
Open the Top Queries card → /app/stocks/AAPL/sentiment
See it in the app
Live dashboard views that match this post. Each tile deep-links to the exact card.
Stocks mentioned
Related reading
Congressional Trades on a Single Stock
The 'Congress outperforms the market' story hides where the actual signal is. It's not aggregate Congressional portfolios, it's a single committee chair's…
Corporate Lobbying Disclosures
Lobbying spend publicly discloses which regulatory fights a company is fighting. A quarter-over-quarter jump in contacts to a new agency often precedes the…
Dark Pool Prints
Off-exchange share above 45% clustered into weakness signals institutional accumulation. Dark pool prints are regulated, post-trade transparent, and measurable.
Google Trends Interest Over Time
Search interest in a brand, product, or ticker often precedes revenue by weeks. Used correctly, same-week year-over-year comparisons, not absolute levels …
Rising Queries: The Narrative Shift Detector
Rising queries catch narrative inflection before it is priced. Breakout searches growing over 5000% in a week signal product launches or incidents days early.
Ready to try alphactor.ai?
Validate your trading strategies with statistical credibility testing. Start free.
Get Started Free