ETF Holdings: How Passive Flows Shape a Stock's Path
For large-cap US equities, 20-40% of shares outstanding sit inside ETFs that trade mechanically on creation/redemption, not fundamentals.
 Marcus Chen7 min read
In February 2024 I was holding a mid-cap industrial that had just reported a clean quarterly beat, revenue +12% YoY, margins up 180 bps, raised full-year guidance. On any conventional reading the stock should have been rewarded. Instead it traded down 6% the day after earnings and another 4% over the following week. The fundamentals view showed nothing that explained it; the sentiment view showed no adverse news. The ETF holdings view explained it in one look. The stock was held at a 3.2% weight in a focused industrials sector ETF that was in the middle of a $1.8B outflow cycle driven by broader rotation out of cyclicals. Two other focused sector ETFs holding the name at 2%+ weights were also in net-redemption mode. The passive flow was mechanically forcing sales of the stock regardless of the fundamentals of the business. Once I understood that, I stopped adding on the dip, the dip wasn't a fundamentals-driven misprice, it was a mechanical-flow-driven dislocation that would persist until the ETF outflow cycle ended. Two months later the sector ETFs stabilized, flows flipped positive, and the stock recovered all 10% of the drop plus another 12%. The lesson: for large-cap and widely-held names, reading the ETF holdings is mandatory before interpreting any move as fundamentally driven.
This post is about the ETF Holdings card, why passive ownership is a first-order driver for most US equities, and the two questions that tell you whether a stock is likely to track its own fundamentals or its ETF overlords.
TL;DR
- Passive ETF ownership is 20-40% of float for large-caps. Moves mechanically on creation/redemption, not fundamentals.
- Sort by ticker weight inside the ETF, not ETF size. A 5% holding in a $1B ETF matters more than a 0.2% holding in a $200B ETF.
- High weight + concentrated holder + redemption flow = passive selling that can disconnect stock from fundamentals for days.
- Broad-ETF dominant holdings track the market tightly; idiosyncratic dispersion is muted.
- Recent creation/redemption flags are where the tradeable signal is, not legacy holdings.
Why ETF exposure is a first-order driver
Passive ETF ownership is no longer a footnote. For US large-cap equities, 20-40% of shares outstanding are held by funds that trade mechanically on creation and redemption orders, not on fundamentals. When investors pull money out of a sector ETF, the ETF's authorized participants redeem shares, which mechanically forces the ETF to sell the underlying stocks in proportion to their weight. The individual stock's quality doesn't enter the calculation; it just gets sold along with the rest of the basket.
The implication is that short-term stock behavior is often dominated by the aggregate flow into or out of the ETFs that hold it. A stock can report a strong quarter and still sell off if the most concentrated ETFs holding it are experiencing outflows that day. Conversely, a stock can rally on weak fundamentals if the sector is experiencing heavy creation flows.
Three scenarios where ETF flow dominates:
- Sector rotation cycles. When capital leaves a sector ETF, every name in the basket is sold; the stock's own fundamentals are temporarily irrelevant.
- Factor rotations. Value vs. growth rotations express through factor ETFs; stocks heavily weighted in factor ETFs experience the flow regardless of their individual factor scores.
- Index rebalances. Index additions and deletions force mechanical buying and selling by all tracking ETFs; the effect can persist for days around the rebalance date.
Once you see a move and reach for fundamentals to explain it, checking whether an ETF flow is driving the move is a cheap sanity check that can save you from adding to a position on the wrong side of a mechanical flow.
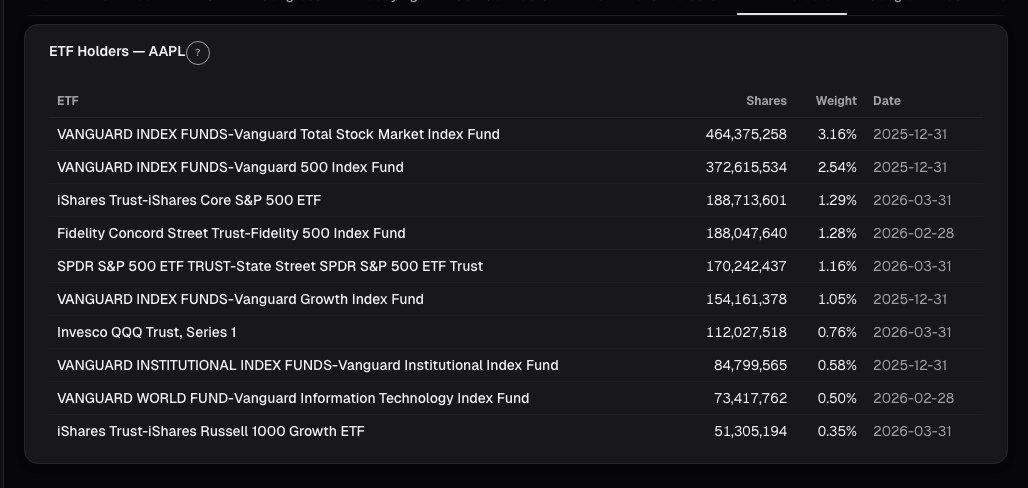
What the ETF Holdings card shows
The ETF Holdings card lists the top ETFs holding the ticker, sorted by the ticker's percentage weight inside each ETF, not by the ETF's total size:
- ETF name + ticker with AUM
- Ticker weight % within each ETF, critical to sort by this, not the ETF's total size
- Shares held by each ETF
- Trailing 5-day ETF flow: positive = creations (buying), negative = redemptions (selling)
- Concentration indicator: is this a focused sector ETF or a broad index ETF?
- Summary row: total shares held across tracked ETFs as a % of float (often 15-35%)
- Flow-flag highlighting ETFs with the largest recent creation or redemption activity
The sort-by-weight choice is the one most traders miss. SPY holds nearly every US large-cap at a low single-digit weight but has massive AUM; a focused sector ETF holds fewer names at 3-5% weight each. The focused ETF's flow has a much larger per-share impact on the stock than SPY's flow, despite SPY being 10× the AUM. Sorting by weight-within-ETF, not ETF-AUM, is how you surface the ETFs that actually matter for the name.
Two questions that matter every time
Is the stock held at high weight in a small, concentrated sector ETF? If yes, redemption flows from that ETF mechanically force proportional sales of the stock. A sector rotation out of the group can cascade fast, the ETF outflow drives stock sales, which drives lower stock prices, which drives more ETF outflows in a self-reinforcing loop. Names like this trade with the sector, not with their fundamentals, for periods of weeks to months.
Is the stock a large holding across many broad ETFs? If yes, the stock tends to track the broad market more tightly, and idiosyncratic dispersion is muted. Earnings beats get rewarded less than they would for a less-ETF'd name because the ETF flow damps the response. This isn't bad, it just means you should expect less volatility from earnings events and more from macro flow regimes.
The combination that matters most, and that I always screen for before interpreting any suspicious move, is high weight + concentrated sector holder + redemption flow. That's the setup where passive selling can disconnect a stock from its fundamentals for days to weeks. Recognizing it prevents the "I don't understand why the stock is down" reaction, which is usually just "I haven't looked at the ETF flow context."
Example: February 2024 industrial
The ETF holdings breakdown for the name I referenced in the intro:
| ETF | Weight in ETF | AUM | 5-day flow |
|---|---|---|---|
| Focused Industrials A | 3.2% | $2.1B | -$180M (redemptions) |
| Focused Industrials B | 2.4% | $0.9B | -$90M |
| Cyclicals Sector | 2.1% | $3.2B | -$220M |
| Mid-Cap Value | 0.8% | $8.4B | -$60M |
| SPY | 0.06% | $510B | +$1.2B (neutral flow per name) |
Three focused holders (the top 3) all in net redemption at the same time. The aggregate passive selling was easily enough to swamp the fundamental tailwind from the earnings beat. Two months later, when the industrial sector stabilized and the focused ETFs flipped to net creations, the stock recovered. The fundamentals had been consistent the whole time; the ETF flow was the driver of the near-term path.
What the card can't tell you
- Why the ETF flows moved. Understanding the macro rotation or sector narrative requires separate context.
- The timing of flow reversal. Flows can persist for weeks to months; the card shows current state, not when it'll change.
- Intraday ETF activity. Creation/redemption data is end-of-day; intraday ETF flow estimates are noisy.
- Derivatives-based passive exposure. Total-return swaps and synthetic positions at prime brokers aren't captured.
- International ETFs. Coverage is primarily US-listed ETFs; international holders have incomplete coverage.
Common mistakes
- Sorting by ETF AUM. A 0.05% weight in SPY is meaningless per-share impact; a 4% weight in a focused ETF is dominant.
- Ignoring the flow column. Holdings tell you the setup; flows tell you whether it's active.
- Assuming ETF flow always dominates. For non-ETF'd names (smaller caps, international listings) the effect is smaller. Check the float-percentage summary before over-weighting the ETF narrative.
- Fighting the flow on fundamentals alone. If three major holders are all in redemption, the stock will likely continue to drift lower regardless of the fundamentals narrative. Wait for flows to stabilize.
- Treating index-rebalance moves as lasting. Mechanical index add/delete moves often reverse within weeks; don't confuse them with durable directional signals.
Where it fits
ETF concentration pairs naturally with Institutional Holders, active fund positioning, to show the full ownership split between active and passive money. For cross-holding and factor exposure views across many tickers, use Universe Heatmap; visual pattern recognition across a sector is much faster than ticker-by-ticker. For the macro rotation context that often drives ETF flows, Universe Trends shows sector-level positioning changes over time.
FAQ
How fresh is the flow data?
Daily. ETF creation/redemption data publishes end-of-day; the card updates overnight.
Does this include ETFs I haven't heard of?
The card covers US-listed ETFs with AUM > $100M. Smaller boutique ETFs may be excluded.
How do I identify "focused" vs. "broad" holders?
The concentration indicator on each row is based on the number of names the ETF holds, under 100 holdings = focused; over 500 = broad. Mid-range ETFs (100-500 holdings) are labeled "moderate."
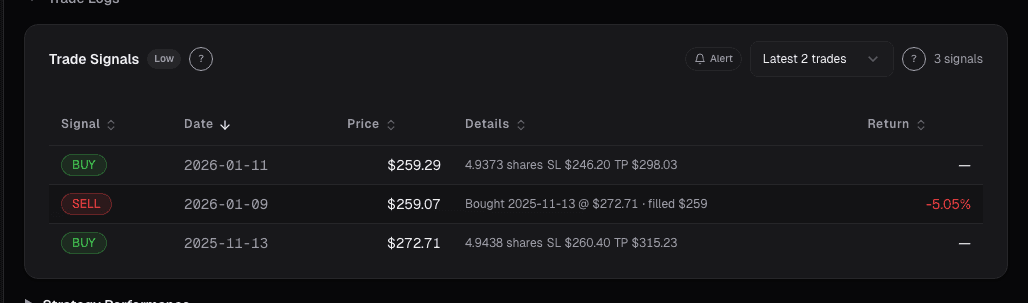
Can I alert on flow changes?
Yes, Trade Alerts supports ETF-flow alerts for watchlist names. Common rule: fire when any top-3 holder flips from net-creation to net-redemption > $50M in a week.
Does this work for ADRs and foreign listings?
Partial coverage. US-listed ADRs with material ETF holder bases are covered; pure foreign listings have incomplete coverage.
Related reading
Open the ETF Holdings card → /app/stocks/AAPL/sentiment
See it in the app
Live dashboard views that match this post. Each tile deep-links to the exact card.
Stocks mentioned
Related reading
Congressional Trades on a Single Stock
The 'Congress outperforms the market' story hides where the actual signal is. It's not aggregate Congressional portfolios, it's a single committee chair's…
Corporate Lobbying Disclosures
Lobbying spend publicly discloses which regulatory fights a company is fighting. A quarter-over-quarter jump in contacts to a new agency often precedes the…
Dark Pool Prints
Off-exchange share above 45% clustered into weakness signals institutional accumulation. Dark pool prints are regulated, post-trade transparent, and measurable.
Dashboard News: A Filtered Stream Across Your Holdings
Generic news feeds drown you in noise. The Dashboard News card filters by your holdings and ranks by sentiment impact: what's new, what matters, why.
Google Trends Interest Over Time
Search interest in a brand, product, or ticker often precedes revenue by weeks. Used correctly, same-week year-over-year comparisons, not absolute levels …
Ready to try alphactor.ai?
Validate your trading strategies with statistical credibility testing. Start free.
Get Started Free