Part of: Risk Management
IV Rank, IV Percentile, and Skew
IV rank, IV percentile, and 25-delta skew answer three different volatility questions. Together they drive trade structure, sell strangles, buy calls, or exit.
 Jake Morrison7 min read
Five years ago I was running a credit-premium book and sold iron condors on a tech name at what I thought was a premium-rich moment. IV30 was 72%, which on its own looked elevated; historical vol over the prior 30 days had been running 45%, making the IV-HV gap look generous. The trade blew up within nine sessions when a product-launch disappointment catalyzed a 23% drawdown, and the short strikes I'd picked as "out of range" traded through to the inside. The post-mortem showed what I'd missed: IV rank was 28 (not rich at all, vol had been *higher* most of the year), IV percentile was 35 (vol was below median for this name), and the 25-delta put skew was in the 90th percentile of its own range. The "premium-rich" tape was a premium-rich single number surrounded by context screaming that the market was paying up specifically for downside, which was the precise move that arrived. I'd read IV30 as the summary statistic and ignored the three that actually contextualize it. The trade cost me about 6% of account. Since then I won't enter a premium-selling position without checking IV rank, IV percentile, and skew together.
This post is about the Options Key Metrics card, what each of those three numbers actually means, and the combinations that tell you whether to sell premium, buy premium, or sit on your hands.
TL;DR
- Raw IV is meaningless out of context. 45% is cheap on biotech and expensive on large-cap consumer staples.
- IV rank = where today's IV sits in its 1-year min/max. Answers "how extreme is this?"
- IV percentile = share of trading days below today's IV. Answers "how often has it been this high?"
- Skew = how much more expensive puts are than calls at equivalent delta. Answers "what is the market specifically paying up for?"
- All three together drive trade structure selection. High rank + flat skew = sell strangles. Low rank + steep skew = buy calls, not puts.
What each number actually measures
IV rank normalizes today's IV against the prior 252 trading days' min and max: `(today_IV - min_IV) / (max_IV - min_IV)`. Output is 0 to 100. An IV rank of 80 means today is closer to the year's high IV than its year's low. This is the answer to "is vol extreme right now by this name's own standards?"
IV percentile measures how many of the prior 252 days had IV below today's: `count(days_below) / 252`. An IV percentile of 60 means today is above 60% of the last year's days. This is the answer to "how often has vol been this high?", which is different from IV rank.
The difference matters when the IV distribution is skewed. A stock that spent 320 of 365 days at 25% IV and 45 days at 60% IV (earnings crashes) would show IV rank 50% at 42% IV, but IV percentile 90% at the same level, because most days were below. IV rank is sensitive to the one big spike; IV percentile is sensitive to the daily distribution.
25-delta skew is the difference in IV between the 25-delta put and 25-delta call. A positive skew means puts are priced with higher IV than equivalent-delta calls, the market is paying more for downside protection than upside exposure. Normal skew for an equity is 3-8 vol points; extreme skew is 15+ vol points and usually signals imminent downside fear.
The three numbers answer three different questions. Traders who confuse them usually end up short premium into the exact move the market was specifically pricing.
What the Key Metrics card shows
The Options Key Metrics card packages the full short-dated-trader scan into one view:
- IV30 (at-the-money, 30-day interpolation): the headline IV number
- IV rank and IV percentile (trailing 252 days)
- 25-delta put/call skew with percentile rank
- Historical volatility (HV30): realized vol over the trailing 30 days
- IV–HV gap: the vol-risk premium (positive means IV is expensive vs. realized)
- Color-banded cells: green when metric is in a range where the obvious trade has worked historically, red when not
- Trailing-6-month chart of IV, IV rank, and skew for trend context
Three combinations that drive trade structure
High IV rank + high IV percentile + flat skew = premium selling territory. Iron condors and short strangles on mean-reverting names work when vol is rich across the full distribution and the market isn't pricing directional fear. The flat skew is the key: steep skew means the market has a specific move in mind, and selling premium is selling insurance to someone who's well-informed about what they're buying.
Low IV rank + steep put skew = cheap vega, expensive crash insurance. Long calls are underpriced in absolute terms (low IV rank), but long puts aren't because skew is rich. The trade is long delta via calls, not long puts for crash protection (which are being priced to the sky). If you want downside exposure in this setup, use put spreads to mitigate the skew cost.
IV > HV by > 1 standard deviation = calendar territory. The market is paying up for expected future volatility that historically hasn't materialized. Calendar spreads (short front-month rich, long back-month cheaper) capture the vol-risk premium. Biggest risk is an actual vol event; size accordingly.
Example: the iron condor that shouldn't have been
My post-mortem reconstruction of the trade from five years ago:
| Metric | Value at entry | What I should have seen |
|---|---|---|
| IV30 | 72% | Looked rich in absolute terms |
| IV rank (252d) | 28 | Vol has been HIGHER most of the year, not rich |
| IV percentile | 35 | Below-median day, not rich |
| 25Δ put/call skew | 13 vol pts | 90th percentile for this name, downside is priced |
| HV30 | 45% | Large IV-HV gap looked attractive |
| Earnings within 14 days? | Yes | Event risk compressed into the window |
The IV-HV gap seduced me; the IV rank / percentile / skew combination was screaming "specific downside move being priced into the front week." Post-event I wrote the lesson as: never sell premium with IV rank < 40 and skew > 75th percentile, ever, regardless of the IV-HV spread. The IV-HV spread is a summary number that can be generated by many combinations, only some of which are premium-selling setups.
What Key Metrics don't tell you
- Direction. IV metrics are volatility, not direction. You still need a directional view separately.
- Event timing. A rich IV can be justified by upcoming earnings; selling premium into earnings is different from selling it into a quiet week.
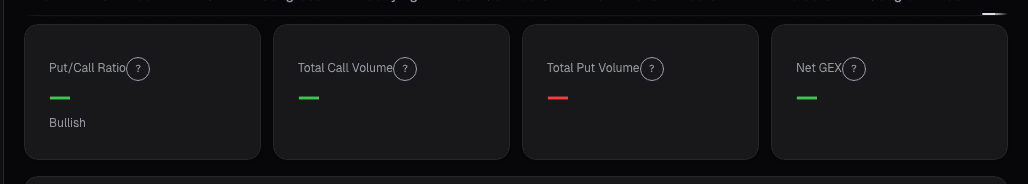
- Dealer positioning. Rich IV and short-dealer-gamma is a different trade than rich IV and long-dealer-gamma. Check GEX separately.
- Term structure. The card shows 30-day-interpolated IV; the term structure (front-week vs. 30d vs. 90d) has its own information.
- Skew by moneyness. The card shows 25-delta skew; the full vol surface (5Δ, 10Δ, 25Δ, 50Δ) has more information for traders who price the full smile.
Common mistakes
- Using IV rank alone. IV rank and IV percentile can diverge; use both.
- Ignoring skew before premium-selling. Steep skew into a quiet IV environment is the exact setup where short premium gets stopped out.
- Assuming IV-HV gap is the whole story. The gap can be generated by event premium (earnings), term-structure arb opportunities, or genuine vol-risk premium, only some of which are tradeable.
- Selling premium into earnings weeks on event names. IV looks rich because the event is unpriced; the premium is fairly priced for the event.
- Buying calls when IV rank is high. If vol is rich, long premium is expensive; consider verticals or diagonals instead of outright calls.
Where it fits
This card is the context layer every other options tool sits on top of. Always check it before acting on Unusual Activity, a large call sweep in a name with IV rank 90 is a very different trade than the same sweep at IV rank 10. Pair with GEX Summary when you want to know whether dealers will amplify or dampen the move, and with Open Interest Magnets for the strike-level pinning context.
FAQ
Is IV rank or IV percentile better?
Both, they answer different questions. IV rank tells you how extreme today is vs. the range; IV percentile tells you how unusual today is vs. the distribution. Use them together; divergence is informative.
What's a "good" IV rank threshold for premium selling?
I use IV rank > 60 with IV percentile > 60 and skew < 75th percentile as my premium-selling zone. Below IV rank 40, I'm long-premium-biased.
How often do the metrics update?
Every 15 minutes during market hours, end-of-day overnight. Skew is recomputed hourly.
Does this work for weekly options?
The card uses 30-day-interpolated IV as the headline. For weekly-specific trading, check the volatility term-structure view separately, front-week IV can be very different from IV30 around events.
What if the name has no options history?
IV rank and percentile require 252 days of history. Recent IPOs (< 1 year options history) show partial-history metrics with a warning flag; treat them with lower confidence.
Related reading
- Options GEX Dealer Positioning
- Options Open Interest Magnets
- Options Unusual Activity Signals
- Options Market Signals
Open the Options Key Metrics card → /app/stocks/AAPL/sentiment
See it in the app
Live dashboard views that match this post. Each tile deep-links to the exact card.

Stocks mentioned
Related reading
The Bollinger Band Squeeze
Bollinger Band squeezes predict volatility expansions. Here is how to identify them, measure their intensity, and avoid the false breakouts.
Gamma Exposure (GEX): How Dealer Hedging Shapes Every Move
Positive vs negative gamma regimes change how the market reacts to shocks. Same tape, same headline, the path depends on whether dealers are damping moves…
What the Options Market Tells You About Stock Direction
How to read implied volatility, put/call ratios, unusual activity, and gamma exposure to extract directional signals from the options market.
Open Interest Magnets
Pinning isn't mysticism, it's observable dealer hedging flow that drags spot toward concentrated-OI strikes into Friday close.
Unusual Options Activity
What qualifies as 'unusual' isn't raw volume, it's volume relative to open interest, aggressor side, and time-to-expiration.
Ready to try alphactor.ai?
Validate your trading strategies with statistical credibility testing. Start free.
Get Started Free