Open Interest Magnets
Pinning isn't mysticism, it's observable dealer hedging flow that drags spot toward concentrated-OI strikes into Friday close.
 Jake Morrison7 min read
In June 2023 I was watching a mid-cap name that had been chopping between $44.50 and $46.50 for the week leading into a monthly OPEX. The OI distribution was showing a massive call wall at $47, over 30,000 contracts, roughly 15× the next-largest call strike, and a slightly smaller put wall at $44. Into the Thursday close, the stock had drifted up to $46.80, which is exactly the kind of approach that sets up a pin trade. Friday morning it tagged $46.95 in the first 20 minutes, paused, and spent the rest of the day oscillating in a 40-cent range centered at $47.00. Final close: $46.98. That was the cleanest OI pin I'd seen in months, and the setup had been visible in the card 48 hours before it played out. The trade I'd structured (short strangle at 45/48 strikes, opened Tuesday when IV rank was 65 and OI distribution was clear) printed a textbook result as theta decayed into the pin. Pinning isn't always this clean, plenty of names blow through their OI walls, especially on news days, but when spot approaches a large wall on low volatility in the final 48 hours, the pin behavior is reliable enough to trade structured around.
This post is about the Open Interest Magnets card, why dealer hedging flow creates observable pinning dynamics, and the three reads that turn OI concentration into tradeable structure.
TL;DR
- Open interest isn't just historical, it's future hedging demand. Dealers short those strikes have to hedge as expiration approaches.
- Call walls above spot act as resistance. Dealers must sell into rallies to stay delta-neutral.
- Put walls below spot act as support. Dealers buy into declines for the same reason, reversed.
- Max pain is a weaker standalone signal but useful as a tiebreaker when walls are balanced.
- Break through a wall on volume reverses dealer flow: dealers chase, moves extend.
Why open interest moves price
Every open option contract someone has to hedge. When a strike builds tens of thousands of contracts of open interest, the dealers net-short that strike own a nonzero delta that grows as expiration approaches and as spot moves toward the strike. Pinning is what happens when dealer gamma gets so concentrated at one strike that the aggregate hedging flow drags spot toward that strike into Friday's close.
The mechanics:
- Dealer short a call strike, spot below strike: dealer is short delta (short the option means short positive delta from the call). As spot rises toward the strike, delta grows rapidly (gamma effect); dealer has to buy shares to stay hedged, but the nearer strike they are to expiration the more the dealer sells the rally to avoid being caught long by expiration assignment.
- Dealer short a put strike, spot above strike: similar mechanics reversed. As spot falls, the dealer buys shares to stay hedged, but close to expiration the dealer buys the decline harder.
- Aggregate effect: when one strike dominates OI, the aggregate hedging flow from dealers short that strike creates a "magnet" pulling spot toward the strike.
The effect is strongest when:
- Single strike dominates the OI distribution (not spread across many strikes)
- Expiration is within 2-5 trading days
- Spot is within 1-2% of the strike
- No major news catalyst is expected before expiration
When these conditions align, pinning is highly reliable. When they don't (news-driven environment, spread OI across multiple strikes, distant expiration), pinning is weak and strikes can be broken through.
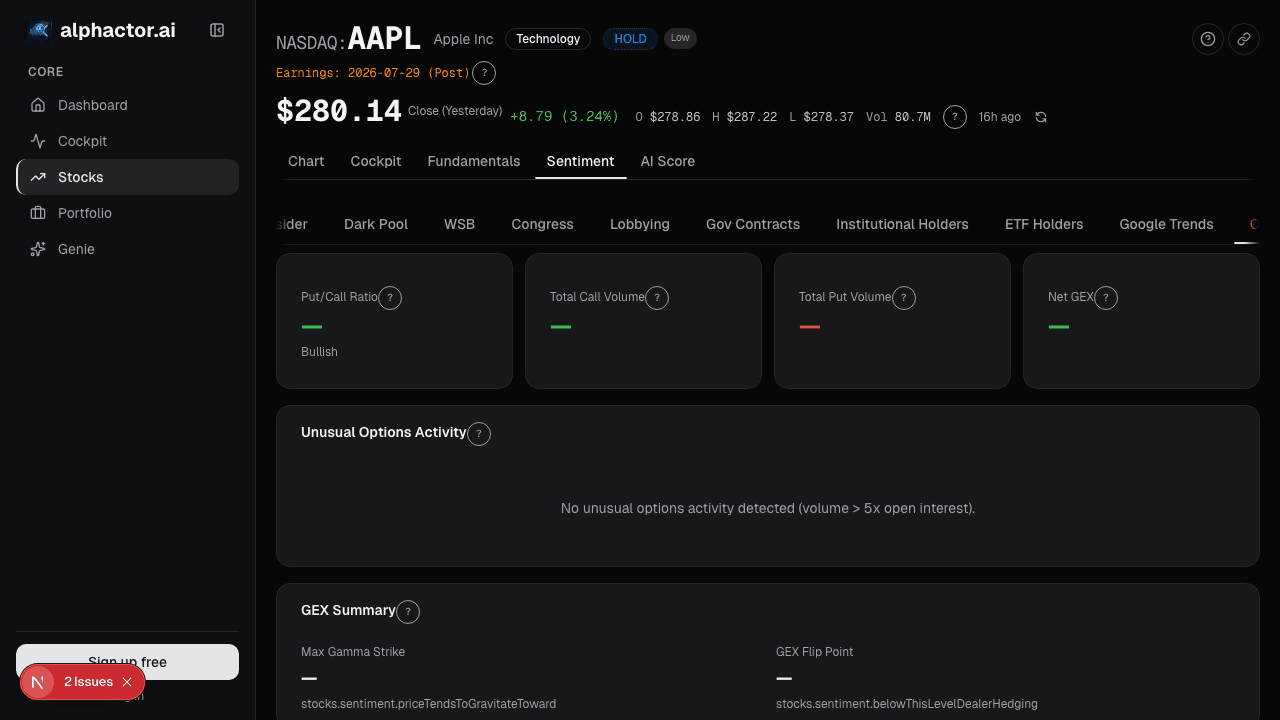
What the Open Interest card shows
The Options Open Interest card visualizes the full strike-by-strike OI distribution for the upcoming expiration:
- OI bar chart: calls and puts separated, strikes on x-axis, contracts on y-axis
- Max-pain strike: the price at which total option value to holders is minimized, calculated from the full chain
- Largest call wall and largest put wall with contract counts
- Put/call OI ratio across the chain
- New-OI flag: strikes that gained material OI in the last 5 sessions, highlighted as where new positioning is being built
- Time-to-expiration countdown: pinning effects strengthen as TTX shortens
- Previous-expiration OI for reference: see whether current OI is unusually concentrated vs. recent history
Three reads
Call walls above spot = resistance. Dealers short those calls must sell into rallies to stay delta-neutral as gamma increases near the strike. This makes approaching the wall difficult; spot tends to stall below it. Breaking through on volume reverses the flow, dealers have to chase, and the move often extends meaningfully beyond the wall once it breaks. Position trades accordingly: short-term expected resistance, but if the wall breaks, respect the continuation.
Put walls below spot = support. Same mechanics in reverse. Dealers short those puts buy into declines to hedge; spot tends to stall above the put wall. A break below with volume triggers dealer selling (to maintain hedges as their exposure changes sign), accelerating the decline. Use put walls as expected support for range trades; use break-of-put-wall as a momentum-entry trigger.
Max-pain as tiebreaker. The max-pain strike (the price at which options in aggregate have the least value to holders) is a weaker signal on its own, it's a composite derived from the entire chain, and many OI distributions generate max-pain strikes that don't correspond to any single dominant wall. It becomes useful when call and put walls are roughly balanced: max-pain tells you which direction the aggregate dealer flow is pulling.
Example: the June 2023 pin
The OI distribution for the mid-cap name I traded:
| Strike | Calls OI | Puts OI | Notes |
|---|---|---|---|
| $50 | 3,200 | 800 | , |
| $49 | 2,100 | 1,200 | , |
| $48 | 4,500 | 2,800 | , |
| $47 | 30,800 | 3,900 | Call wall (15× next-largest) |
| $46 | 5,600 | 6,200 | , |
| $45 | 3,100 | 14,200 | , |
| $44 | 2,400 | 18,500 | Put wall |
| $43 | 1,800 | 4,100 | , |
Spot on Thursday close was $46.80. Call wall at $47 (30,800 contracts, dominant), put wall at $44 (18,500 contracts). The pin trade: short strangle at 45/48 strikes, betting on spot pinning inside the wall band into Friday close. Spot tagged $46.95 in the first 20 minutes of Friday, then oscillated inside a 40-cent range at $47.00 all day. Final close $46.98. Both short strikes expired OTM; the strangle captured full theta. Clean result.
The setup I look for: spot within 2% of the dominant wall, TTX ≤ 2 trading days, no scheduled news. When those align the pin is reliable.
What OI can miss
- News days. An earnings or guidance event can blow through any wall. Check the earnings calendar before building a pin trade.
- Cross-expiration flows. Positioning at the weekly expiration can be overshadowed by larger monthly expirations the following week; the card shows TTX-relevant OI but longer-dated positioning shapes the broader dealer book.
- Aggressive new positioning. If OI is being added aggressively in the last 2 days, the distribution shape on Thursday may not match Friday. The new-OI flag helps.
- Institutional hedging vs. speculation. OI can't distinguish whether the contracts represent hedges for existing equity positions (less hedging flow needed) or speculative bets (more hedging flow required).
- Low-liquidity names. Pinning effects are reliable on high-liquidity underlyings where dealer hedging is smooth. Thinly-traded names can pin or not-pin somewhat randomly.
Common mistakes
- Pinning the wrong expiration. Pinning is most reliable at monthlies and standard weeklies; non-standard expirations have weaker effects.
- Ignoring GEX sign. In positive-GEX regimes, pinning is strong; in negative-GEX regimes, walls can break more easily. Always cross-check.
- Trading news-day pins. Events override the mechanical hedging flow. Check the calendar.
- Short premium at wide strikes without understanding the walls. Your short strikes should be outside the obvious walls, not straddling them.
- Assuming max-pain is the pin price. It often isn't, the dominant single wall is usually the actual pin, not the aggregate max-pain.
Where it fits
Open interest tells you *where* the gamma lives; GEX Summary tells you *how* that gamma affects realized volatility. Use them together: OI walls to pick your short strikes, GEX sign to decide whether to structure as premium-selling (positive GEX = damped vol) or premium-buying (negative GEX = amplified vol). Pair with Key Metrics for the IV context, pinning plus high IV rank is premium-selling territory; pinning plus low IV rank is the setup for buying the dominant wall on breakout.
FAQ
How often does the OI data update?
Daily, end of day (exchanges publish OI overnight). Intraday OI estimates are not reliable.
Can pinning fail?
Yes, regularly, most often on news days or when OI is spread across multiple strikes without a dominant wall. Pinning is reliable in specific conditions, not universal.
Does this work for index options?
Yes, and often more reliably, SPX and SPY OI distributions are deep and pinning effects on monthly OPEX are well-documented.
What about 0DTE options?
0DTE has different dynamics, dealer hedging flow is intense but time-decayed. Pinning effects at 0DTE are sharper but less predictable.
How do I know if a wall will break?
You don't always. The break risk is higher when volume spikes, news hits, or when the approach is rapid rather than gradual. Sizing pin trades should reserve capital for wall-break scenarios.
Related reading
- Options GEX Dealer Positioning
- Options IV Rank, Key Metrics
- Options Unusual Activity Signals
- Options Market Signals
Open the Open Interest card → /app/stocks/AAPL/sentiment
See it in the app
Live dashboard views that match this post. Each tile deep-links to the exact card.
Stocks mentioned
Related reading
Gamma Exposure (GEX): How Dealer Hedging Shapes Every Move
Positive vs negative gamma regimes change how the market reacts to shocks. Same tape, same headline, the path depends on whether dealers are damping moves…
IV Rank, IV Percentile, and Skew
IV rank, IV percentile, and 25-delta skew answer three different volatility questions. Together they drive trade structure, sell strangles, buy calls, or exit.
What the Options Market Tells You About Stock Direction
How to read implied volatility, put/call ratios, unusual activity, and gamma exposure to extract directional signals from the options market.
Unusual Options Activity
What qualifies as 'unusual' isn't raw volume, it's volume relative to open interest, aggressor side, and time-to-expiration.
Ready to try alphactor.ai?
Validate your trading strategies with statistical credibility testing. Start free.
Get Started Free