Stress Testing Your Portfolio
How to use Alphactor's portfolio stress testing to simulate historical crashes, measure VaR, and understand your real downside risk.
 Marcus Chen4 min read
You Do Not Know Your Portfolio's Risk Until You Test It
Most investors can tell you their portfolio's return over the last year. Very few can tell you what would happen to it during a 2008-style financial crisis, a COVID-19 crash, or a sustained bear market like 2022. The gap between knowing your upside and knowing your downside is where stress testing lives.
Alphactor's portfolio analytics include stress testing, Value at Risk calculations, drawdown analysis, and risk attribution, all designed to answer the question every investor should ask before a crisis, not after: how bad could it get?
What Portfolio Stress Testing Actually Measures
A stress test takes your current holdings and runs them through historical crisis scenarios. It uses the actual correlation structure between your positions during those periods, not theoretical correlations based on calm markets. This is important because correlations spike during crises. Stocks that seemed diversified in normal times can move in lockstep when panic hits.
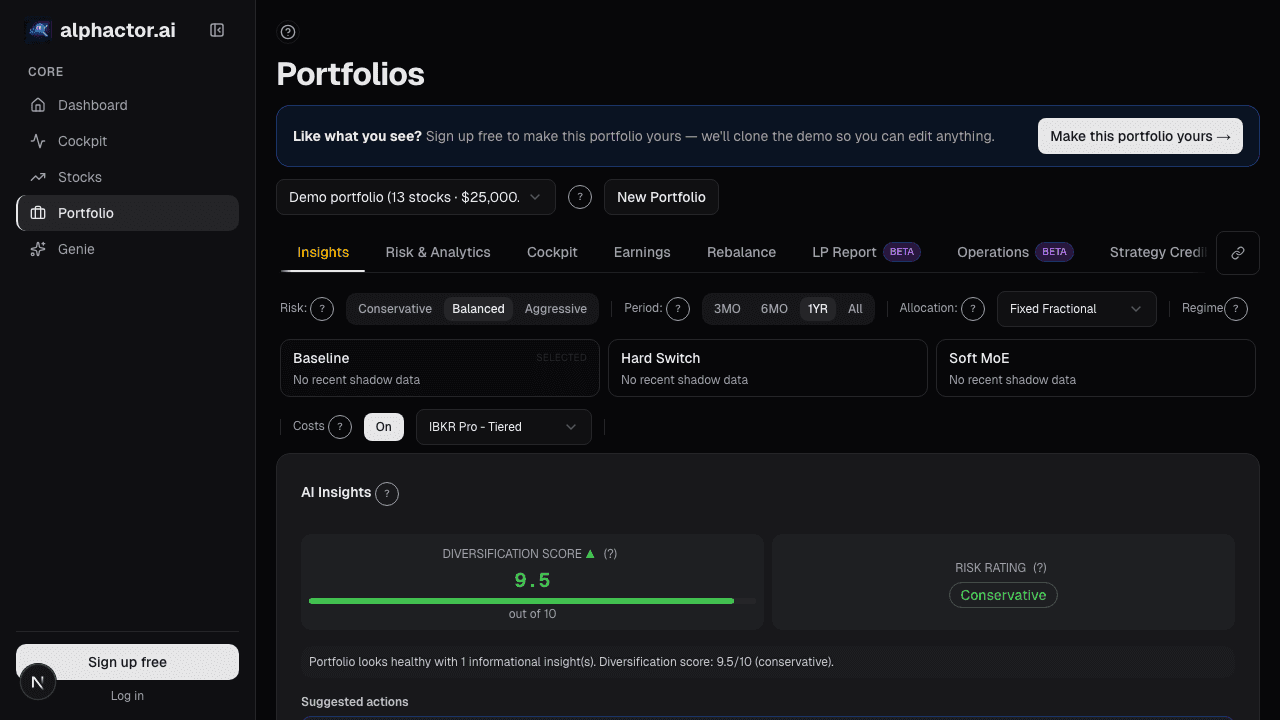
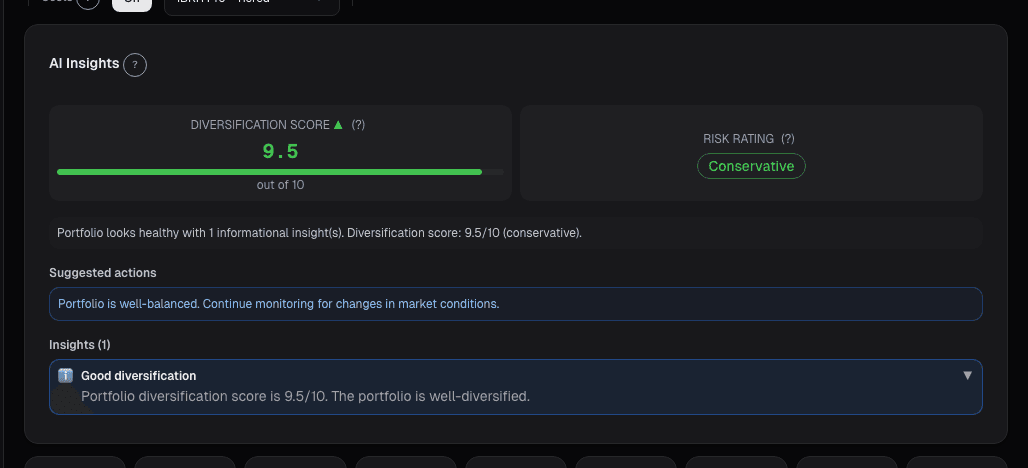
On the portfolio dashboard, when you build a portfolio with your holdings and cost basis, the platform calculates several risk analytics. The stress test simulates how your specific allocation would have performed during major historical drawdowns. The result is a concrete dollar and percentage loss estimate, not a vague "your portfolio is moderate risk" label.
Walking Through a Stress Test
Here is what the workflow looks like in practice. You create a portfolio on Alphactor, add your holdings with share counts and cost basis, and navigate to the analytics tab. The platform runs a simulation that produces a tear sheet of risk metrics.
You will see metrics including Value at Risk (VaR), which estimates the maximum loss you can expect over a given period at a given confidence level. A 95% daily VaR of -2.1% means that on 95 out of 100 trading days, your portfolio should not lose more than 2.1%. On that hundredth day, it could lose significantly more.
The drawdown analysis shows your portfolio's worst historical peak-to-trough declines, how long they lasted, and how long recovery took. If your portfolio's worst drawdown was 35% and took 14 months to recover, you need to honestly assess whether you could hold through that without panic selling.
Risk attribution breaks down where your risk is concentrated. You might discover that 60% of your portfolio's volatility comes from two positions. That is actionable information. Diversification only works if risk is actually distributed, not concentrated in a few correlated names.
Before and After Stress Testing
Before stress testing: You hold a portfolio of 12 stocks. You feel diversified because you own names across technology, healthcare, and financials. You have no idea that three of your tech positions are 85% correlated and together represent 45% of your portfolio value.
After stress testing: The simulation shows that during a 2020 COVID-style crash, your portfolio would have dropped 38%, primarily driven by those three tech positions moving in unison. The risk attribution confirms the concentration. You decide to trim the most correlated position and add a less-correlated holding, reducing the simulated drawdown to 26%.
That 12-percentage-point improvement in worst-case performance did not require a radical portfolio change. It required knowing where the risk was hiding.
Using Stress Tests to Set Position Sizes
Stress testing is not just a one-time diagnostic. It is a tool for sizing new positions. Say you want to add NVDA to a portfolio that already has significant tech exposure. Add it to your Alphactor portfolio as a hypothetical holding and rerun the simulation. If the stress test shows your maximum drawdown increases from 28% to 37%, you know that position size is too large for your risk tolerance. Scale it down and retest until the drawdown impact is acceptable.
This approach replaces gut-feel position sizing with evidence-based allocation.

The Simulation Engine
Alphactor's portfolio simulation runs your holdings through a backtesting engine that accounts for entry timing, position sizing, and correlation dynamics. The simulation produces a time series of portfolio value, daily snapshots, per-stock attribution, and aggregate risk metrics.
The results include a correlation matrix that shows how your holdings move relative to each other. High positive correlations between positions mean less diversification than the number of stocks suggests. Negative or low correlations indicate genuine diversification benefit.
You can also run simulations with different risk profiles. The platform supports conservative, balanced, and aggressive profiles that adjust how strategies are scored and weighted. Switching between profiles shows you how your portfolio's risk characteristics change under different assumptions.
Why This Matters Now
Markets have been volatile. Interest rate uncertainty, geopolitical risk, and sector rotations have made portfolio construction harder than usual. In this environment, knowing your downside is not optional, it is survival.
A portfolio that looks great in a bull market can be devastating in a drawdown if you did not understand the underlying risk structure. Stress testing gives you that understanding before the market teaches it to you the hard way.
The portfolio analytics on Alphactor are available to all plan tiers, with additional depth on Pro and Premium. Even the basic analytics surface enough information to catch obvious concentration risks and poorly correlated positions.
See it in the app
Live dashboard views that match this post. Each tile deep-links to the exact card.


Related reading
The AI Copilot: Ask Your Portfolio a Question
How Alphactor's AI Copilot turns natural language questions into data-driven portfolio insights, grounded in your actual holdings and market data.
Custom Compliance Rules: Build Guardrails for Your Portfolio
How to use Alphactor's compliance rules to enforce position limits, sector caps, and risk thresholds automatically across your portfolios.
Alt-Data Sentiment at the Portfolio Level
Per-ticker alt-data breaks down past 10 positions. A roll-up of WSB, news, MSPR, and options lets a 90-second scan replace 100 minutes of manual checking.
Portfolio Attribution: Where Your Returns Actually Come From
Beating the benchmark by 400bps feels good until attribution tells you it was all allocation luck on one sector call. Selection vs. allocation vs.
Portfolio Audit Trail: Every Decision
Regulated managers need an audit trail. The Audit Trail card on alphactor.ai records every trade, rebalance, alert, and note into one timestamped log you…
Ready to try alphactor.ai?
Validate your trading strategies with statistical credibility testing. Start free.
Get Started Free