Insider MSPR: The Ratio That Cuts Through Form 4 Noise
MSPR strips 10b5-1 sales to show discretionary insider buying. Cluster above 0.7 from three or more insiders has outperformed by 4-6% over three months.
 Marcus Chen7 min read
In October 2023 I was watching a mid-cap healthcare name that had drawn down 31% over the prior four months on competitive-dynamics fears. The question was whether the selling had exhausted itself or had further to run. The headline insider data was mixed, gross dollar sells of $12M over the quarter, gross dollar buys of $1.8M. On the surface, insiders were net sellers by 7-to-1. The MSPR chart told a different story. Monthly ratio jumped from 0.38 (red zone, net selling) in August to 0.72 (green zone, net buying) in September, with the count of distinct insiders transacting rising from 2 to 6. The gross dollars hid the shift because one executive was liquidating a large 10b5-1 plan on schedule; when you excluded that one filer and looked at the ratio of discretionary activity, five distinct insiders had made open-market purchases in September. The $1.8M of buying represented personal-cash conviction by five different people; the $12M of selling was one person's scheduled liquidation. I sized into the stock over the next three weeks. Over the following five months it recovered 58% as the competitive fears proved overstated. The MSPR flip was the single cleanest insider signal I'd seen that quarter, and it was invisible in the dollar-weighted headline. That's the value of the ratio view: it tells you which direction the *people* are moving, not which direction the *dollars* happen to fall.
This post is about the Insider MSPR chart, why the ratio view cuts through the noise in raw Form 4 data, and the two patterns that have held up in both academic research and my own backtests.
TL;DR
- Raw insider dollar counts are dominated by 10b5-1 scheduled sales and mechanical option-exercise sells.
- MSPR (Monthly Stock Purchase Ratio) strips mechanical activity and shows the ratio of discretionary buying to discretionary selling.
- Cluster buying (> 0.7 with ≥ 3 distinct insiders) has historically outperformed by 4-6% over 3 months.
- Dry-up after sustained buying (falling through 0.5) is often a better exit signal than outright selling.
- Ignore single-insider months: the sample isn't large enough to be informative.
Why raw Form 4 counts mislead
"Insiders sold $50M of stock this quarter" is a useless sentence without decomposition. The $50M could be:
- One executive exercising expiring options and immediately selling to cover taxes (mechanical, zero information)
- Routine 10b5-1 plan sales filed 10 months ago (noise, zero information)
- Secondary-offering sales as part of an exit plan (book-building, not signal)
- A retiring executive liquidating (rational, weakly informative)
- Or, rarely, actual discretionary selling on material information (signal)
Gross dollar weighting gives equal credit to each, which means the headline is dominated by the large categories (1-3) that carry no information, while the small category (5) that actually matters gets drowned out. The ratio view is the correction: divide discretionary buying by discretionary selling, count distinct participants, and you have a metric where the signal-to-noise is much higher.
MSPR specifically:
- Includes only discretionary transactions: P-coded open-market buys and non-plan S-coded sales
- Excludes 10b5-1 plan transactions, option exercises, tax-withholding sales, gifts, and grants
- Normalizes to a ratio: not dollar count, not share count, just buy/sell mix
- Aggregates monthly: smooths over the day-to-day noise, highlights patterns
- Counts distinct insiders: so a single large trade doesn't dominate the ratio
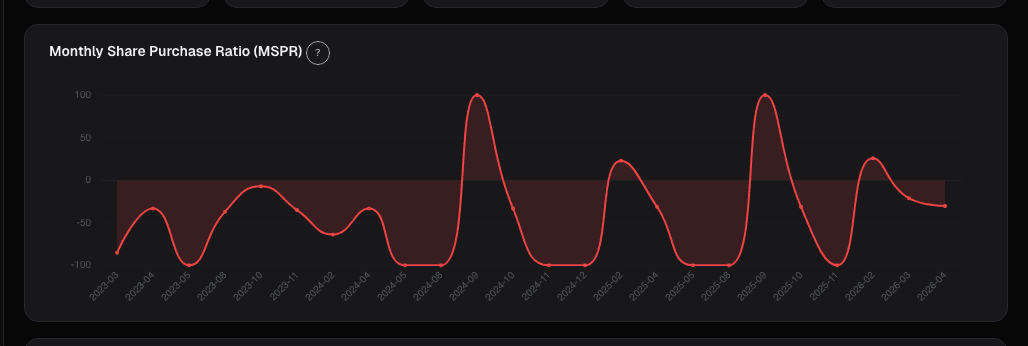
What the MSPR chart shows
The Insider MSPR chart plots rolling monthly buy/sell ratios over the trailing 24 months alongside the stock's price. Core views:
- MSPR line: monthly ratio, color-coded green/grey/red
- Green band: ratio > 0.6 (net buying dominant)
- Grey band: 0.4-0.6 (mixed)
- Red band: < 0.4 (net selling dominant)
- Distinct-insider count: secondary line showing how many people transacted that month
- 10b5-1 amendment overlay: shaded months where a plan was amended (often around material events)
- Price overlay: the stock's chart on the same axis so you can see the relationship between insider activity and price
Role breakdown:
- By role: CEO, CFO, other NEO, director, 10% owner
- By direction within role: CFO buying while directors sell is different from the reverse
- Historical consistency: whether current MSPR is unusual for this specific ticker vs. its own history
Two patterns that have held up
Cluster buying predicts outperformance. MSPR > 0.7 with ≥ 3 distinct insiders transacting in the same month has historically preceded 3-month outperformance by 4-6% on average (both in published academic work, the Seyhun / Jaffe literature, and in my own backtests on the card's historical data). The signal is strongest when:
- The stock has recently drawn down 15-30% (insiders have purchasing conviction at distressed prices)
- The CFO is one of the purchasers (CFOs have better information about near-term financials than most other officers)
- The dollar amounts are personally meaningful (CFO buying $250k is often more informative than director buying $50k)
- The month follows a period of negative news or analyst downgrades
Single-insider cluster-buying signals are much weaker, one person's conviction can be wrong, or reflect personal circumstances. The multi-person cluster is where the signal band lives.
Dry-up after sustained buying is a better exit signal than outright selling. When a stock has been running and MSPR has been green for 4+ consecutive months, the moment that matters is the first month MSPR falls through 0.5 (into grey). That's a pause, insiders aren't selling, they're just not buying anymore. Historically, the pause signal precedes 3-month underperformance more reliably than outright selling does, because outright selling is often driven by plans and diversification (noise), while a pause after a buying run reflects conviction change (signal). The ratio dropping from 0.75 → 0.45 while count stays steady (same people, different direction) is the specific pattern to watch.
Example: the October 2023 healthcare setup
The MSPR chart snapshot going into the trade:
| Month | MSPR | Distinct Insiders | Gross $ Buy | Gross $ Sell | Stock Price Action |
|---|---|---|---|---|---|
| June 2023 | 0.42 | 2 | $0.1M | $3.8M | -8% |
| July 2023 | 0.41 | 3 | $0.2M | $4.1M | -12% |
| August 2023 | 0.38 | 2 | $0.1M | $3.9M | -6% |
| September 2023 | 0.72 | 6 | $1.8M | $12.0M | -5% |
The September snapshot looked bearish on dollar-count ($12M sold vs $1.8M bought, 7-to-1 net sells). But MSPR jumped to 0.72 because:
- The $12M sell was almost entirely one insider's scheduled 10b5-1 plan liquidation (excluded from MSPR)
- The $1.8M of buying was five distinct insiders making discretionary open-market purchases (P-coded, non-plan)
- Distinct insider count rose from 2 to 6
- Three of the six were NEOs (CFO + two VPs)
Ratio-adjusted, the activity was predominantly discretionary buying by multiple people while a scheduled sell executed on its pre-determined date. Over the subsequent five months the stock recovered 58% as competitive concerns proved overstated and the insiders' conviction was validated. The dollar-weighted headline would have kept me out; the ratio view got me in.
What MSPR can miss
- Small sample months. When only 1-2 insiders transact, the ratio is noisy; treat those months as neutral.
- Plan-amendment gaming. Sophisticated insiders can amend 10b5-1 plans to route discretionary decisions through the mechanical channel; MSPR won't catch this.
- Indirect transactions. Trust-based transactions are harder to interpret and sometimes miscoded.
- Timing lag. Form 4 reporting takes up to 2 business days; MSPR is as fresh as the filings.
- Role context. A director buying $20k means less than a CFO buying the same. MSPR doesn't weight by role, the role breakdown view is needed for this nuance.
Common mistakes
- Reading raw dollar counts. Dollar weighting is dominated by mechanical transactions; the ratio is the signal view.
- Ignoring distinct-insider count. Single-insider months are low-information even at high ratios.
- Acting on one month. MSPR is most useful in sequence, a flip from red to green sustained for 2+ months beats a one-month spike.
- Overweighting historical edges. The 4-6% outperformance is an average; individual setups can diverge widely. Treat as a prior, not a prediction.
- Ignoring role. CFO signals ≠ director signals ≠ 10%-owner signals. Check the role breakdown.
Where it fits
Pair MSPR with the rest of the Insider tab, especially the Insider Transactions table to confirm the ratio comes from real P-coded open-market buys, not miscoded activity. For macro context, check the Insider Summary card which aggregates roles and direct-vs-indirect holdings. When MSPR turns green at the same time Unusual Options Activity shows call sweeping, two independent signal sources are agreeing on direction, that's rare and worth attention.
FAQ
How fresh is the data?
Form 4s appear within 48 hours of filing (SEC rule). MSPR recomputes as each new filing arrives.
What counts as "discretionary"?
Open-market purchases (P code) and non-plan open-market sales (S code without 10b5-1 flag). Plan sales, option exercises, grants, gifts, and tax withholdings are excluded.
Why monthly and not weekly?
Form 4 filings are too sparse at weekly granularity to be reliable; monthly aggregation gives enough sample to be informative while still being responsive.
Is MSPR a buy signal on its own?
No, it's an input. Combine with fundamentals, chart setup, and sector context. Insider signals are priors, not stand-alone decisions.
Does MSPR work for all market caps?
Best on mid- and large-cap. Small-cap insider activity is sparse enough that MSPR can be noisy month-to-month.
Related reading
Open the MSPR chart → /app/stocks/AAPL/sentiment
See it in the app
Live dashboard views that match this post. Each tile deep-links to the exact card.
Stocks mentioned
Related reading
Congressional Trades on a Single Stock
The 'Congress outperforms the market' story hides where the actual signal is. It's not aggregate Congressional portfolios, it's a single committee chair's…
Corporate Lobbying Disclosures
Lobbying spend publicly discloses which regulatory fights a company is fighting. A quarter-over-quarter jump in contacts to a new agency often precedes the…
Dark Pool Prints
Off-exchange share above 45% clustered into weakness signals institutional accumulation. Dark pool prints are regulated, post-trade transparent, and measurable.
Dashboard News: A Filtered Stream Across Your Holdings
Generic news feeds drown you in noise. The Dashboard News card filters by your holdings and ranks by sentiment impact: what's new, what matters, why.
Form 4 Decoded: Insider Trades That Mean Something
A '$2M insider sale' headline hides what actually happened. A discretionary sale at CEO-level the week after a bad call is loud; the same CEO selling on a…
Ready to try alphactor.ai?
Validate your trading strategies with statistical credibility testing. Start free.
Get Started Free