Monte Carlo Simulation
How Monte Carlo simulations model thousands of possible portfolio outcomes and why they are more useful than single-point forecasts.
 Marcus Chen4 min read
The Problem with Forecasts
When someone says "this portfolio should return 8% per year," they are giving you a single number for an outcome with thousands of possible paths. The market could return 8% smoothly, or return 25% in year one and -10% in year two. The average hides the range, and the range determines whether you hold your plan or panic sell at the bottom.
Monte Carlo simulation replaces the single forecast with a probability distribution. Instead of "what will happen?" it asks "what could happen?" and shows you how likely each outcome is. Think of it as the difference between a forecast of "70 degrees" and one that says "60 to 80 degrees with a 20% chance of rain."
How It Works
The mechanics are simpler than the name suggests. A Monte Carlo simulation runs your portfolio through thousands of hypothetical market scenarios, typically 1,000 to 10,000 iterations. Each iteration randomly generates a sequence of returns based on the historical characteristics of your holdings: their average returns, their volatility, and their correlations with each other.
After running all iterations, you get a distribution of outcomes. For a five-year horizon, you might see:
- Best 10% of scenarios: Portfolio grows to $180,000+
- Median scenario: Portfolio grows to $140,000
- Worst 10% of scenarios: Portfolio declines to $85,000
That worst-case band is the critical information. It tells you the magnitude of loss that is plausible, not just theoretically possible but statistically likely in one out of every ten futures.
What Monte Carlo Reveals That Averages Hide
Sequence of returns risk. A portfolio that averages 8% per year but experiences a 30% drawdown in year one ends up with less money than one that earns a steady 8%. The early loss reduces the base that subsequent gains compound on. Monte Carlo captures this because each simulation generates a different sequence. The spread between outcomes shows you how much sequence risk your portfolio carries.
Tail risk. The worst 5% of simulated outcomes represent tail events: deep recessions, prolonged bear markets, simultaneous declines across asset classes. If the 5th percentile outcome is a 40% decline, that is a one-in-twenty event. Over a 20-year investing career, you will likely experience it at least once.

The impact of withdrawals. For anyone drawing income from a portfolio, Monte Carlo is indispensable. A 4% withdrawal rate is sustainable in the median scenario but can deplete the portfolio in the bottom 15% of scenarios if a bear market hits early in retirement. Running the simulation with your actual spending plan reveals whether your withdrawal rate survives bad sequences.
Running a Useful Simulation
Not all Monte Carlo simulations are equal. The quality of the output depends on the quality of the inputs and assumptions.
Use realistic return assumptions. Plugging in the S&P 500's historical 10% average return overestimates future returns because it reflects a period of rising valuations that may not repeat. A more conservative 6-7% real equity return is defensible based on current valuations.
Model correlations, not just individual assets. A simulation that treats each holding independently underestimates the chance of simultaneous losses. Incorporate the correlation structure of your portfolio, including the tendency for correlations to increase during stress.
Test multiple time horizons. A portfolio that looks acceptable over 10 years might show alarming outcomes over 3 years. Run simulations for the shortest period over which you might need the money.
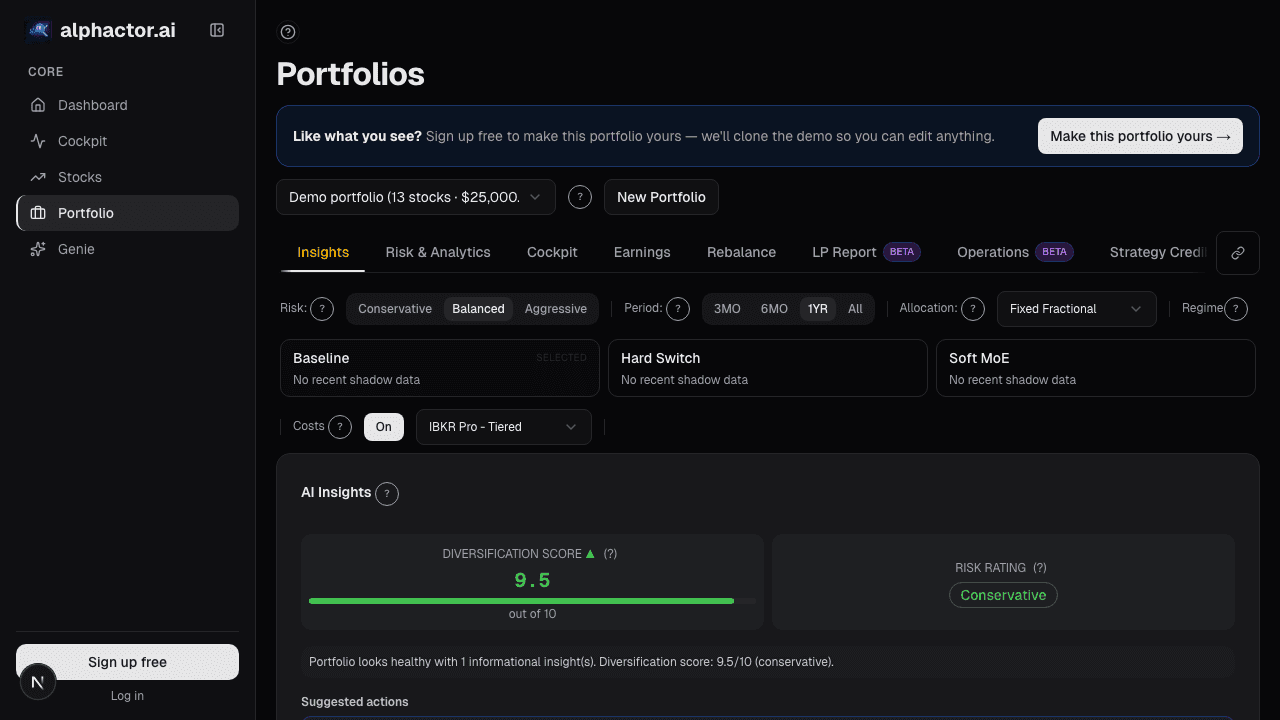
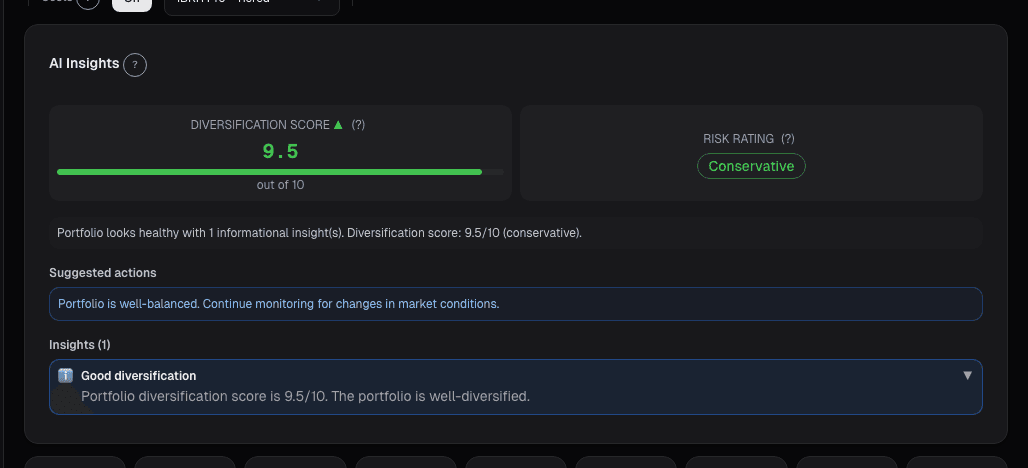
Alphactor's portfolio dashboard simulation engine runs Monte Carlo analysis on your actual holdings, incorporating position-level volatility and correlation data. The output shows the probability cone for your specific portfolio, not a generic model, making it directly actionable for position sizing and risk decisions.
Interpreting the Results
The goal is not to predict the future. It is to understand the range of possibilities and decide whether you can live with the downside.
Focus on the left tail. The 10th percentile outcome is the one that matters for risk management. If that number represents a loss you cannot tolerate financially or emotionally, your portfolio is too aggressive.
Compare portfolios, not just scenarios. Monte Carlo is most powerful as a comparison tool. Run your current portfolio and an alternative allocation through the same simulation. If the alternative has a similar median outcome but a significantly better 10th percentile outcome, the risk-adjusted case for switching is strong.
Revisit assumptions. Markets change. A simulation run in 2019 used different correlation and volatility inputs than one run in 2023. Re-run your simulation at least annually, or after any significant market regime change, to ensure your understanding of the risk range is current.
The Limits
Monte Carlo has blind spots. It typically assumes returns follow a normal distribution, but real markets have fatter tails: extreme events happen more often than the bell curve predicts. The 2008 crisis was a 5+ standard deviation event that many models assigned near-zero probability. Stress testing with historically observed crisis scenarios addresses this gap.
Despite its limits, Monte Carlo remains the most practical tool for understanding portfolio risk across a range of futures. It replaces false certainty with informed uncertainty, the honest foundation for every investment decision.
See it in the app
Live dashboard views that match this post. Each tile deep-links to the exact card.


Related reading
Choosing the Right Benchmark (Hint
Why benchmarking against the wrong index distorts your performance assessment and how to select a benchmark that matches your actual portfolio.
Paper Trading Account Summary
Paper trading works only when you treat it like a real book. The Account Summary card on alphactor.ai tracks cash, positions, P&L, and execution quality so…
Alt-Data Sentiment at the Portfolio Level
Per-ticker alt-data breaks down past 10 positions. A roll-up of WSB, news, MSPR, and options lets a 90-second scan replace 100 minutes of manual checking.
Portfolio Attribution: Where Your Returns Actually Come From
Beating the benchmark by 400bps feels good until attribution tells you it was all allocation luck on one sector call. Selection vs. allocation vs.
Portfolio Audit Trail: Every Decision
Regulated managers need an audit trail. The Audit Trail card on alphactor.ai records every trade, rebalance, alert, and note into one timestamped log you…
Ready to try alphactor.ai?
Validate your trading strategies with statistical credibility testing. Start free.
Get Started Free