Part of: Technical Analysis
Relative Strength (Not RSI)
Why comparing a stock's performance against SPY, its sector, and its peers is a stronger signal than any oscillator for identifying future outperformers.
 Marcus Chen5 min read
The Confusion That Cost Me Years
For the first five years of my trading career, every time someone mentioned "relative strength," I thought they meant RSI. The Relative Strength Index. I would nod along in trading forums and wonder why people were so excited about a 0-100 oscillator I already had on my charts.
They were not talking about RSI. They were talking about relative performance, how a stock performs compared to a benchmark, sector, or group of peers. It is a completely different concept, and it took me embarrassingly long to figure this out. Once I did, it fundamentally changed how I select stocks.
What Relative Strength Actually Measures
Relative strength is simple: divide the stock's price by a benchmark's price over time. If AAPL/SPY is rising, Apple is outperforming the S&P 500. If it is falling, Apple is underperforming. You do not even need a formula, it is a ratio chart.
There are three levels I track:
Vs. SPY (broad market). Is this stock beating the overall market? A stock that goes up 15% when SPY is up 10% is showing relative strength. A stock that drops 5% when SPY drops 12% is also showing relative strength, it is falling less.
Vs. sector ETF. Is this stock beating its own sector? If XLK (tech sector ETF) is up 8% and MSFT is up 14%, Microsoft is outperforming its peers. If both XLK and MSFT are down but MSFT is down less, that is meaningful.
Vs. direct peers. How does the stock rank within its closest competitors? In the semiconductor space, is NVDA outperforming AMD, AVGO, and QCOM? Peer-level relative strength is the most granular view and often the most actionable.
Why Relative Strength Is a Better Signal
An oscillator like RSI tells you about a stock in isolation, is it overbought or oversold relative to its own recent history? That is useful, but it misses the bigger picture. A stock can be "overbought" on RSI at 75 and still be one of the best investments available if everything else is weaker.
Relative strength tells you about a stock in context. It answers the question that actually matters for capital allocation: "Where should my money be right now?"
The research backs this up. James O'Shaughnessy's work in "What Works on Wall Street" showed that buying stocks with the strongest 12-month relative strength against the market produced annualized returns significantly above the benchmark over decades of data. Momentum works, and relative strength is how you measure it.
My own experience confirms this in a way that is hard to ignore. In the March 2020 crash, I was watching which stocks held up best during the selloff. AMZN, MSFT, and COST showed the strongest relative strength versus SPY during the worst weeks. They did not go up, everything crashed, but they fell less. Those three stocks went on to lead the recovery. AMZN nearly doubled from its March low to the September peak.
The signal was not "buy these because they are oversold." They were not particularly oversold on RSI. The signal was "buy these because they are stronger than everything else during peak panic." That is relative strength.
The Downturn Test
The most valuable time to measure relative strength is during market pullbacks. Anyone can outperform in a raging bull market. The stocks that outperform their sector during a 10-15% market correction are telling you something important: institutional money is not leaving.
When the market drops and a stock holds flat or barely dips, large holders are not selling. They might even be buying the dip while dumping weaker names. This creates a coiled spring effect. Once the market stabilizes, these relative strength leaders tend to rip first and hardest because the selling pressure that hit their peers never hit them.
I screen for this specifically. After any market pullback of 5% or more, I rank stocks by their drawdown relative to SPY. The ones that fell least get added to my watchlist. This simple process has identified many of my best trades.
Tracking Relative Strength Practically
You can calculate relative strength manually with a ratio chart (stock price divided by benchmark price, plotted over time). A rising ratio line means outperformance. A falling ratio line means underperformance.
For screening across hundreds of stocks, I calculate the 20-day and 60-day performance difference between each stock and SPY, then rank the universe. Stocks in the top 20% on both timeframes are my focus list for long entries.
The universe scanner handles this by incorporating relative performance into its signals. When a stock shows strong momentum with high conviction, part of what drives that score is how the stock is performing relative to its benchmark and peers. A stock that is trending up while its sector is flat gets flagged differently than one that is simply riding a sector-wide move, because the former has stock-specific strength while the latter might just be beta. You can also use stock comparison to visualize relative performance between specific names.
Relative Strength in Action: A Real Example
In early 2024, the semiconductor sector was broadly strong, but not all names participated equally. NVDA and AVGO were dramatically outperforming the sector ETF (SMH), while INTC and MCHP were lagging badly. Buying "semiconductors" as a group would have given you a mixed bag. Buying the relative strength leaders within the sector focused your capital on the names with the most institutional sponsorship.
NVDA's relative strength versus SMH had been positive for over six months by that point. The ratio chart was in a clean uptrend. When the AI narrative expanded, the stock that was already outperforming its sector continued to outperform by an even wider margin.
This is not hindsight analysis. The relative strength data was visible in real time, every single day. The stocks that are winning tend to keep winning. It is one of the most persistent anomalies in markets, and it does not require a complex model to exploit, just the discipline to buy strength instead of hunting for bargains in the junk pile.
Stop Buying Weakness
The natural human instinct is to buy cheap. Traders see a stock down 40% and think "bargain." Sometimes it is. More often, it is down 40% for a reason, and it is about to be down 50%.
Relative strength flips this instinct. Instead of buying what has fallen the most, you buy what has fallen the least or risen the most relative to the benchmark. It feels wrong at first. You are buying stocks that have already moved. But the data, across decades and multiple markets, shows that this approach works. Strength begets strength, and relative strength is how you find it. The leaderboard ranks stocks by momentum and conviction, putting the relative strength leaders front and center.
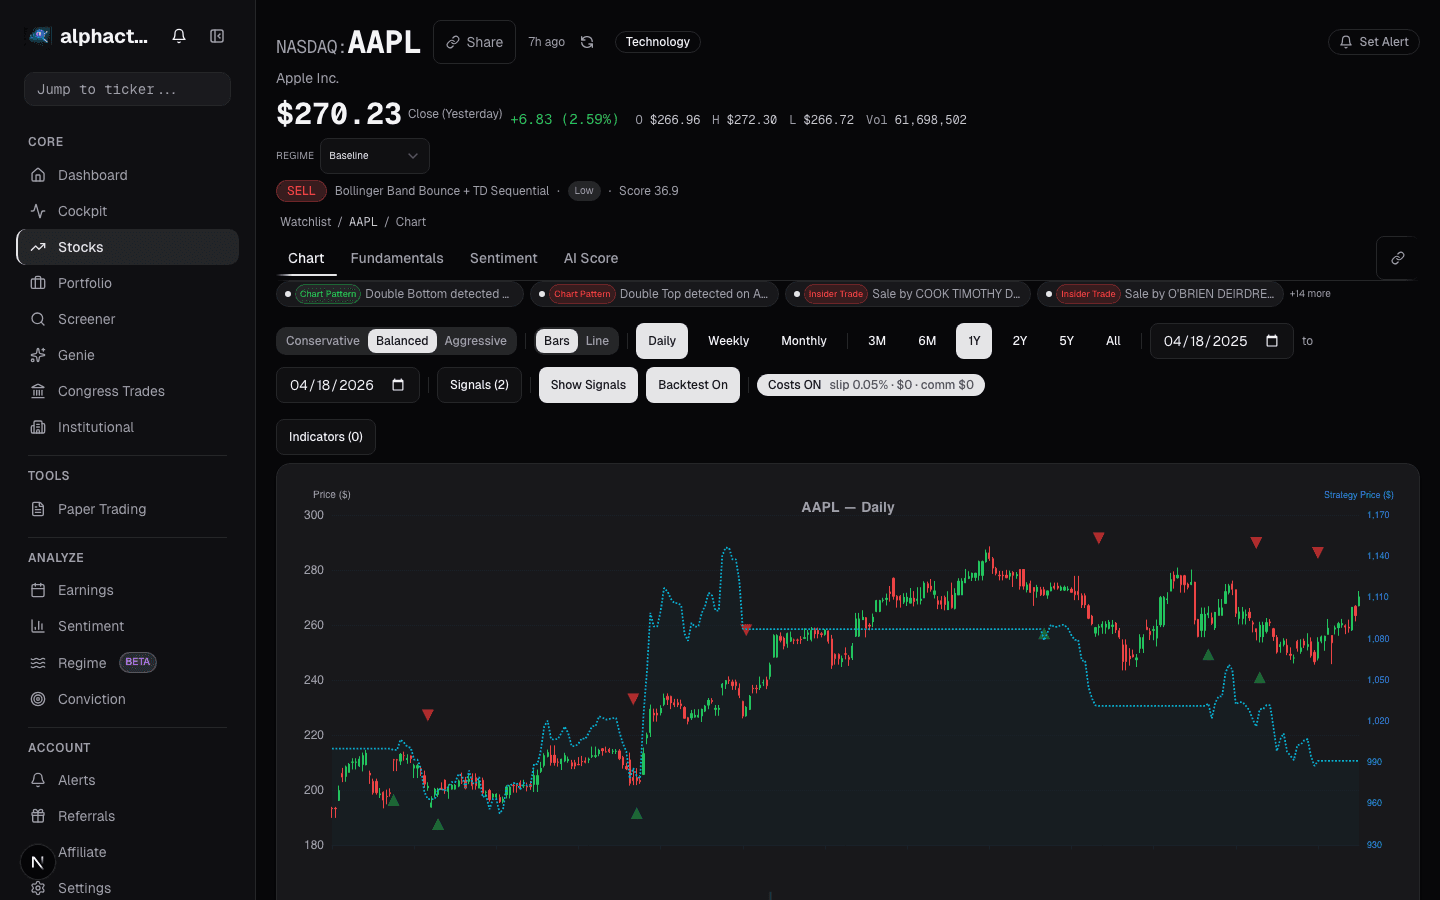
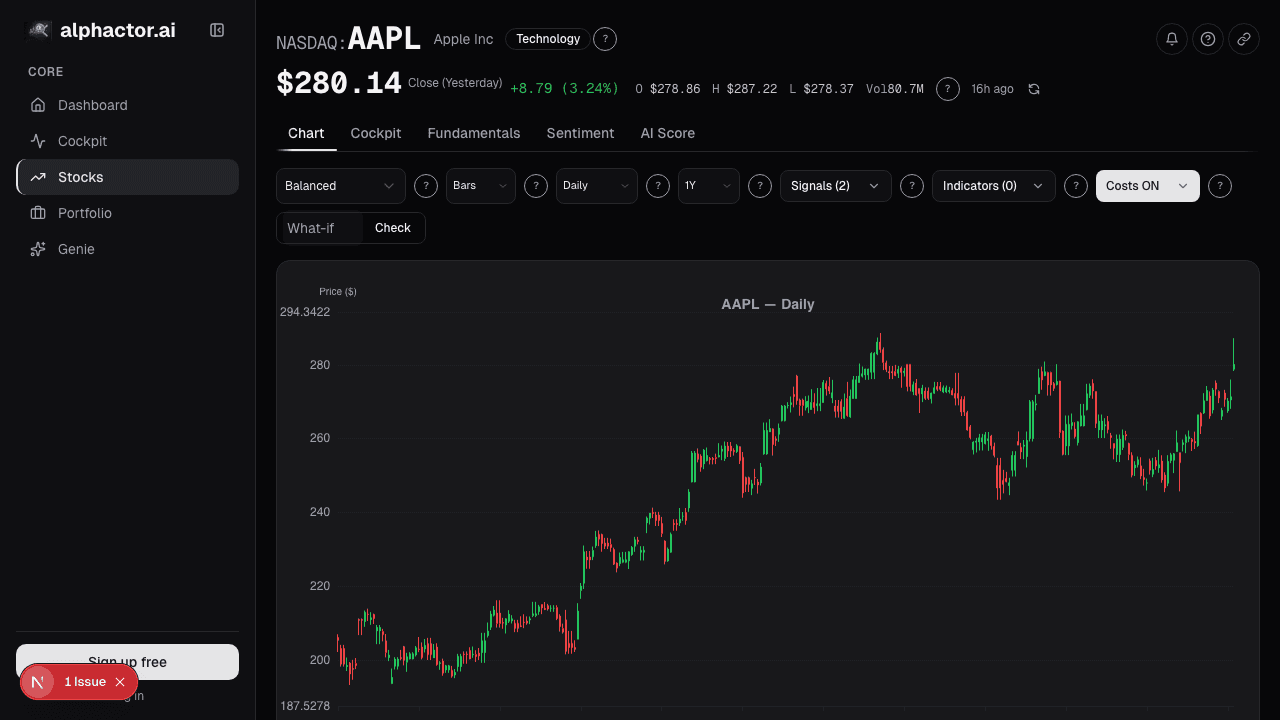
See it in the app
Live dashboard views that match this post. Each tile deep-links to the exact card.


Stocks mentioned
Related reading
Chart Benchmark: Relative Strength Is Where the Alpha Lives
Absolute price charts hide what's tradeable. Plotting a stock as a ratio against SPY, its sector, or a peer group reveals the idiosyncratic alpha that…
Cockpit Cards: Quick-Glance Intelligence per Stock
How cockpit cards surface the signals, events, and changes that matter most across your watchlist and portfolio without information overload.
Building a Momentum Score
Combine rate of change, relative strength, and moving average slope into a composite momentum score to screen for stocks with the strongest trends.
Portfolio Monitoring With Less Noise
Most portfolio dashboards show you everything. Here is how to filter down to the changes that actually require your attention.
Turn Your Watchlist Into an Active Research System
A passive watchlist wastes your time. Learn how to turn yours into a system that surfaces actionable intelligence on the stocks you care about.
Ready to try alphactor.ai?
Validate your trading strategies with statistical credibility testing. Start free.
Get Started Free