The Sector Rotation Playbook
How institutional capital rotates between sectors as the economic cycle turns, and how to track rotation signals to position ahead of the crowd.
 Marcus Chen4 min read
The Economy Moves in Cycles. So Does Sector Leadership.
In 2020, technology and consumer discretionary led the market as fiscal stimulus and remote work drove digital adoption. By 2022, energy was the only sector with positive returns while tech collapsed. In 2023, technology surged again while energy lagged. These were not random outcomes. They followed a pattern that has repeated across every economic cycle for the past century.
Sector rotation is the process by which institutional capital flows from one sector to another as the economy transitions between expansion, peak, contraction, and recovery. The sequence is remarkably consistent, even if the timing varies. Understanding where you are in the cycle tells you where to look for leadership next.
The Four Phases
Early expansion (recovery): The economy is emerging from recession. Interest rates are low or falling. Credit is loosening. Consumer confidence is rebuilding from depressed levels. In this phase, the most beaten-down cyclical sectors lead: consumer discretionary, financials, industrials, and real estate. These sectors benefit first from the upturn because they are most leveraged to improving economic activity. The 2020-2021 recovery after COVID was a textbook example, with consumer discretionary returning over 30% in the twelve months following the March 2020 bottom.
Mid expansion (growth): The recovery is established. Corporate earnings are accelerating. Employment is strong. This is where technology and communication services tend to dominate. Companies are investing in productivity and growth. Consumers are spending confidently. The mid-2023 to mid-2024 period, driven by AI capital expenditure and resilient consumer spending, fit this pattern.
Late expansion (peak): Growth is decelerating but still positive. Inflation is building. The Fed is tightening or expected to tighten. Energy and materials benefit from rising commodity prices. Healthcare holds up due to its defensive characteristics combined with late-cycle pricing power. In the second half of 2021, energy stocks began their massive outperformance run as oil prices surged and inflation took hold.
Contraction (recession): Earnings are declining. The economy is contracting. Capital flows to safety: utilities, consumer staples, and healthcare. These sectors have stable demand regardless of economic conditions. During the 2008 financial crisis, consumer staples fell roughly 15% while financials fell over 55%. In the 2022 drawdown, utilities were the best-performing sector through September while growth collapsed.
Reading the Signals
The challenge is identifying transitions in real time. Three sets of signals help.
Yield curve and credit spreads: The shape of the Treasury yield curve is one of the most reliable leading indicators of economic phase. An inverted curve (short rates above long rates) has preceded every recession since 1960. Credit spreads widening (corporate bonds cheapening relative to Treasuries) signal deteriorating confidence in corporate health. Both provide months of lead time before the economy turns.
PMI and leading indicators: The ISM Manufacturing PMI above 50 signals expansion; below 50 signals contraction. The inflection points, when the PMI crosses 50 in either direction, are where sector leadership typically shifts. New orders minus inventories is an even more forward-looking sub-indicator.
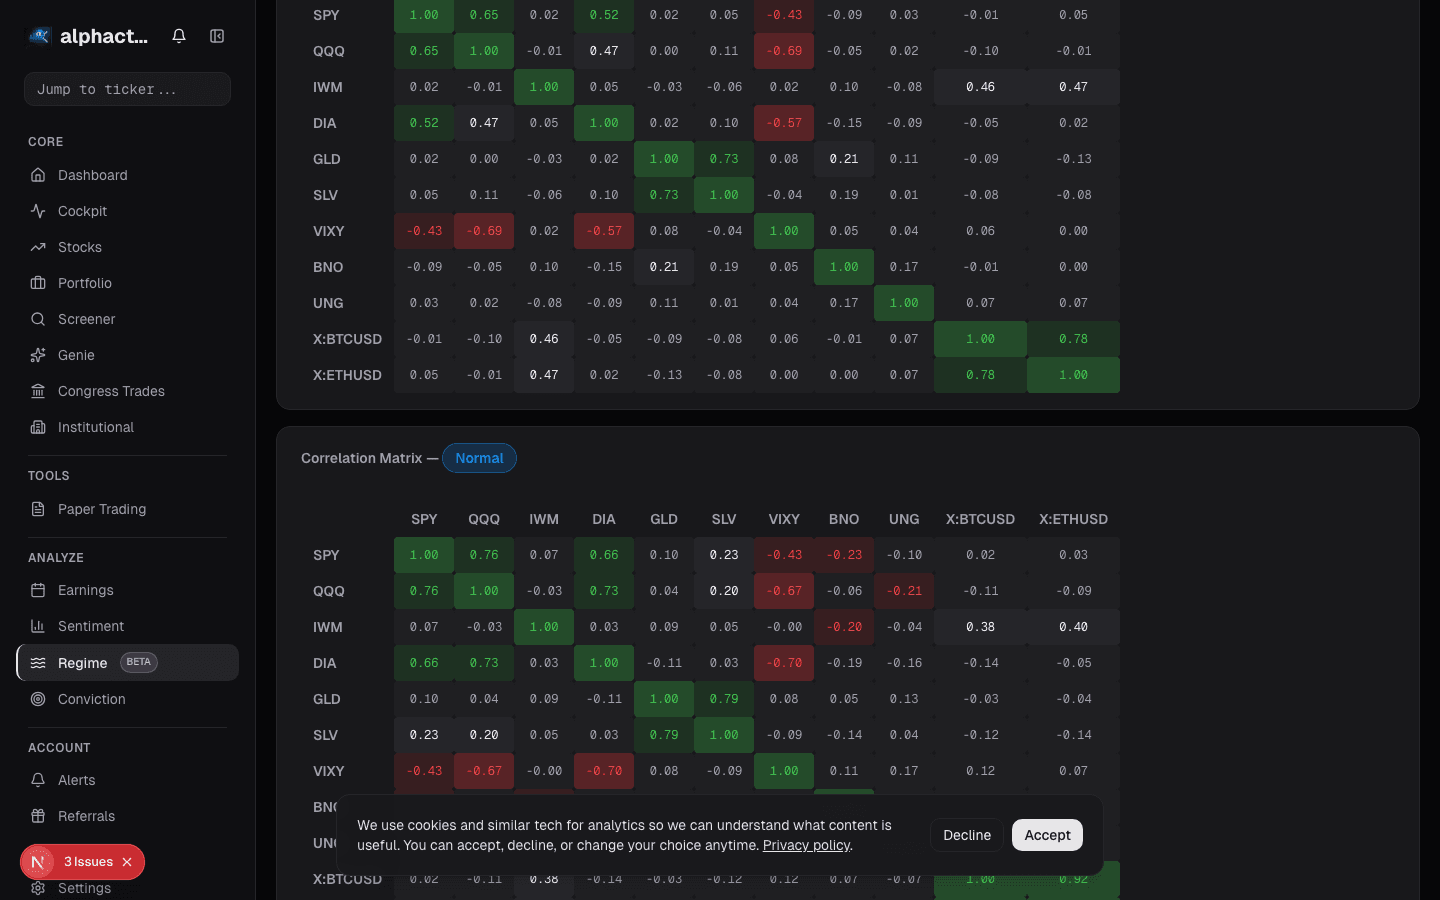
Relative strength shifts: When defensive sectors start outperforming cyclicals on a rolling three-month basis while the index is still rising, the market is sniffing out a slowdown before it appears in economic data. The universe scanner visualizes these relative strength shifts across all eleven GICS sectors in real time.
The Rotation Within Sectors
Rotation does not just happen between sectors. It happens within them. In technology, the cycle moves from hardware (early cycle) to software (mid cycle) to defensive tech (late cycle, think Microsoft and Apple with their recurring revenue). In financials, banks lead in early expansion when the yield curve steepens, while insurance and asset managers lead in late expansion.
Tracking sub-industry performance reveals these interior rotations. A broad sector may look flat while massive rotation is happening underneath the surface.
Common Mistakes
The most frequent error is fighting the cycle. Investors fall in love with the sector that made them money in the last phase and refuse to rotate. Technology investors in late 2021 had every reason to trim and shift toward energy and value, but muscle memory from a decade of tech dominance kept them fully allocated.
The second mistake is rotating too early. Calling the exact top of a sector's outperformance is nearly impossible. The practical approach is to begin tilting gradually as the economic signals shift, rather than making binary all-in or all-out decisions.
Building a Rotation Framework
Start by identifying the current economic phase using the indicators above. Then tilt your sector allocation toward the historical leaders for that phase while maintaining diversification.
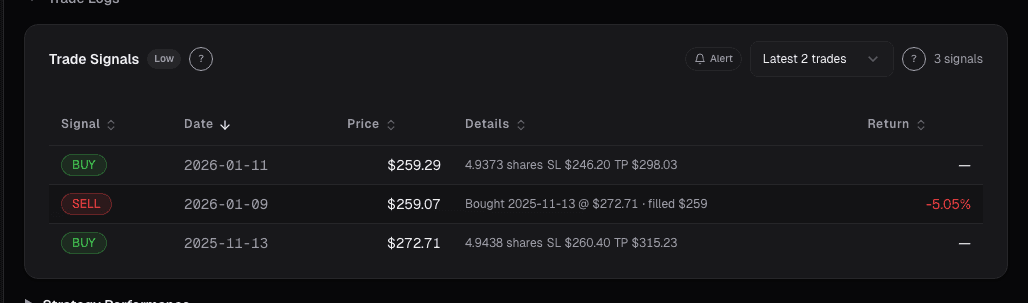
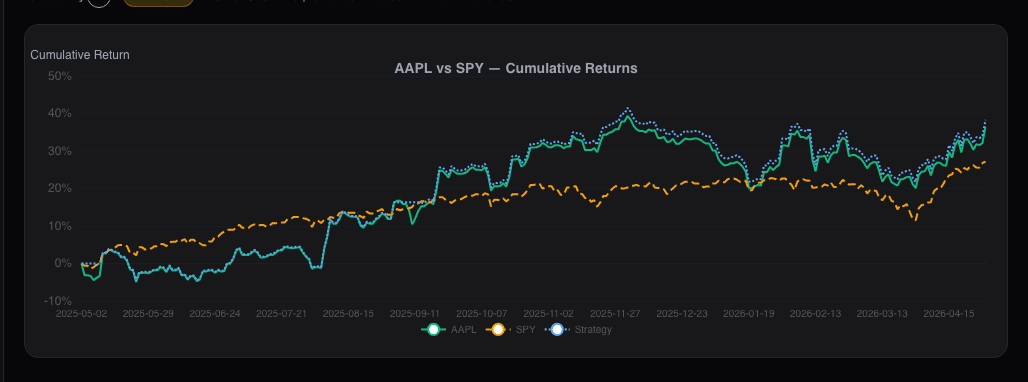
Use the Alphactor charts to monitor which sectors are gaining or losing relative strength on a weekly basis. When you see a persistent shift, with a new sector establishing higher relative highs for three or more consecutive weeks, that is confirmation that rotation is underway.
The sector rotation cycle is not a prediction tool. It is a probabilistic framework that tells you where the wind is blowing. Investors who position with the cycle, not against it, capture the compounding effect of owning the right sectors at the right time.
See it in the app
Live dashboard views that match this post. Each tile deep-links to the exact card.
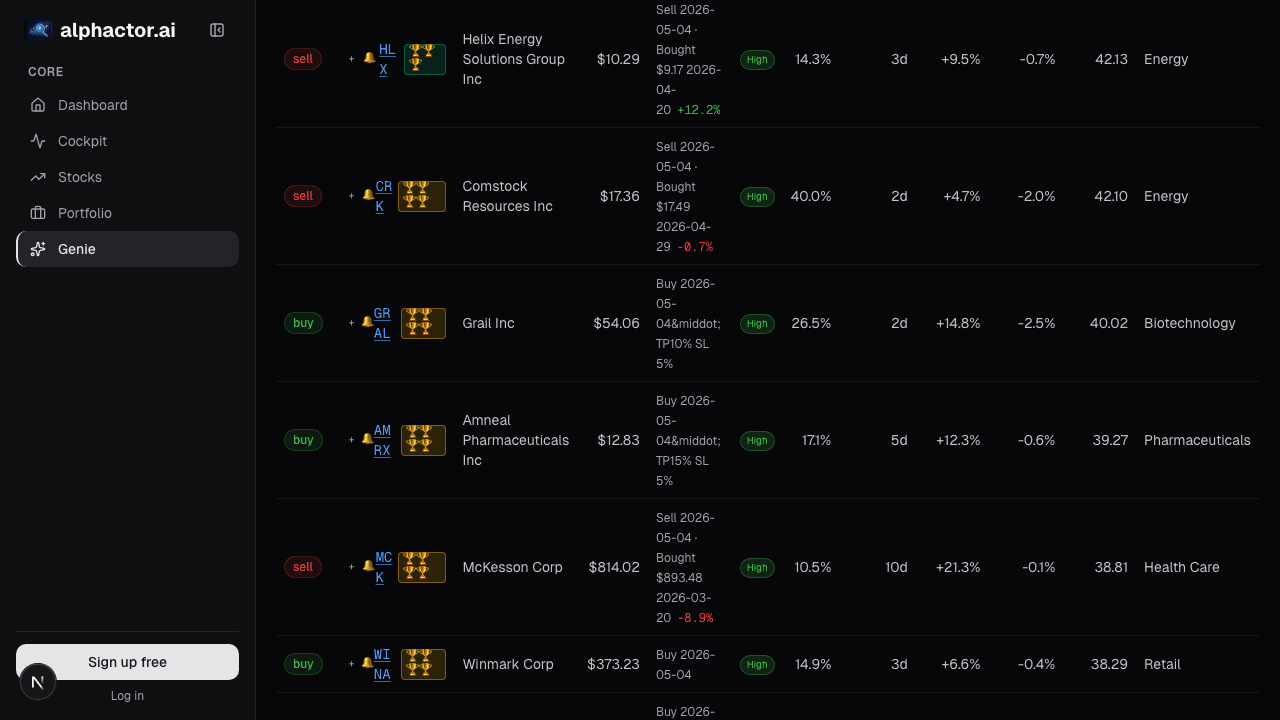
Stocks mentioned
Related reading
How to Analyze Tech Stocks
The financial metrics that separate winning tech investments from hype-driven traps, with frameworks for evaluating SaaS, hardware, and platform businesses.
Defense Stocks: Government Contracts as a Revenue Moat
How defense contractors generate durable revenue through government contracts, and the metrics that matter for analyzing Lockheed Martin, RTX, and their peers.
Industrial Stocks: Betting on the Real Economy
How industrial stocks track economic growth, the leading indicators that predict their performance, and a framework for investing across the industrial…
Universe Trends
Sector dispersion over 10-week windows runs 12-18 percentage points. Identifying the rotation before the macro narrative forms matters more than stock-picking.
Utility Stocks for Income: Yield, Safety
How to evaluate utility stocks for income portfolios, including the regulatory framework, rate sensitivity dynamics, and metrics that identify quality…
Ready to try alphactor.ai?
Validate your trading strategies with statistical credibility testing. Start free.
Get Started Free