Trend Following on Stocks
Trend following works on stocks, but not the way most retail traders implement it. A systematic breakdown of what the data shows across 20 years of backtests.
 Marcus Chen4 min read
The Misconception
Most retail traders equate trend following with buying stocks that are going up. They see NVDA running from $15 to $140 and say "that is a trend follow." It is not. Trend following is a systematic process for capturing sustained directional moves while managing losses when trends reverse. It is defined by its exit rules, not its entry rules.
The managed futures industry has generated billions using trend following on commodities, currencies, and bonds. Applied to individual stocks, the approach requires specific adaptations that most retail implementations ignore. The result is a strategy that looks good on a chart but bleeds money in live trading.
What Goes Wrong
Three structural mistakes account for most retail trend-following failures on stocks:
1. No exit discipline. Trend following requires cutting losers quickly. A 200-day moving average crossover system on individual stocks will have a win rate between 35% and 42%. That means the majority of trades lose money. The strategy works because the winners are 3-5x larger than the losers. But without mechanical exits, traders hold losers hoping for recovery, and the math breaks.
2. Concentration in one regime. Trend following on stocks is inherently long-biased. In a bear market, a long-only trend system should be mostly in cash, but traders keep fishing for upside signals. The 2022 bear market generated 14 false breakout signals on SPY between January and October. Each one failed.
3. Wrong lookback period. Academic evidence shows that intermediate-term momentum (6-12 months) captures the strongest effect on individual stocks. Most retail trend followers use short-term indicators (20-day or 50-day moving averages), which generate excessive whipsaws and lower profit factors.
A Systematic Approach That Works
We tested a 10-month (approximately 200-day) moving average crossover on the S&P 500 constituents from January 2004 through December 2024:
- Entry: Buy when a stock closes above its 10-month moving average at month-end
- Exit: Sell when it closes below the 10-month moving average
- Universe: Current and historical S&P 500 members (survivorship-bias-free dataset)
- Position sizing: Equal weight, maximum 20 positions, minimum $50B market cap filter
- Rebalance: Monthly
Over 20 years:
- CAGR: 10.7%
- Maximum drawdown: -23.8%
- Win rate (per trade): 39.4%
- Average winner: +18.2%
- Average loser: -5.7%
- Profit factor: 1.81
- Average holding period: 7.3 months
SPY buy-and-hold over the same period returned approximately 10.2% CAGR with a -55.2% maximum drawdown. The trend system delivered comparable returns with less than half the peak-to-trough loss. In 2008, the system drew down only -14.1% because most positions hit their moving average exits in September-October and the portfolio moved to cash.
The Win Rate Problem
A 39.4% win rate is psychologically brutal. Six out of every ten trades lose money. If you are manually reviewing each trade and deciding whether to take it, you will inevitably skip some entries. And the ones you skip will disproportionately include the big winners, because the biggest winners are often the ones that feel most uncomfortable at entry (buying a stock at a new high after a long consolidation does not feel safe).
This is why systematic execution is non-negotiable. The edge in trend following is entirely in the tails of the return distribution. The average winner of +18.2% includes a subset of trades that gained 40%, 60%, or more. Missing even a few of those trades by hesitating or overriding the system destroys the expected value.
Walk-Forward Evidence
We validated the strategy using the Alphactor backtesting walk-forward engine with 60-month in-sample and 12-month out-of-sample windows, rolled annually. The walk-forward efficiency ratio was 0.68 across 15 out-of-sample periods. Eleven of the 15 periods were profitable.
The four unprofitable periods were 2011 (European debt crisis whipsaw), 2015-2016 (range-bound market), 2018 (Q4 sell-off and recovery), and 2023 (narrow market leadership in mega-cap tech caused many mid-cap positions to churn). All four unprofitable periods had losses under -6%, well within the expected distribution for a trend system.
Position Sizing Is the Strategy
Most trend-following education focuses on entry and exit signals. The actual determinant of long-term performance is position sizing. We tested volatility-adjusted sizing (targeting 1% daily risk per position) against equal weight (5% per position). Volatility-adjusted sizing produced a CAGR of 11.3% with a max drawdown of -19.1% and a Sharpe of 0.91, versus 10.7% CAGR and 0.79 Sharpe for equal weight. It automatically reduced exposure to volatile names and increased exposure to steady trends, smoothing the equity curve.
What Trend Following Is Really About
Trend following on stocks is a bet that momentum persists in the intermediate term. The evidence is robust across decades of data and multiple international markets. But the implementation details (lookback period, exit discipline, position sizing, regime awareness) separate a profitable system from an expensive hobby.
The edge is not in knowing that trends exist. The edge is in executing a validated system through the long losing streaks that inevitably precede the large winners. Testing that system through walk-forward validation and Monte Carlo simulation via Alphactor backtesting before deploying capital is the minimum standard for taking trend following seriously. Visualize trend signals in real time on Alphactor charts.
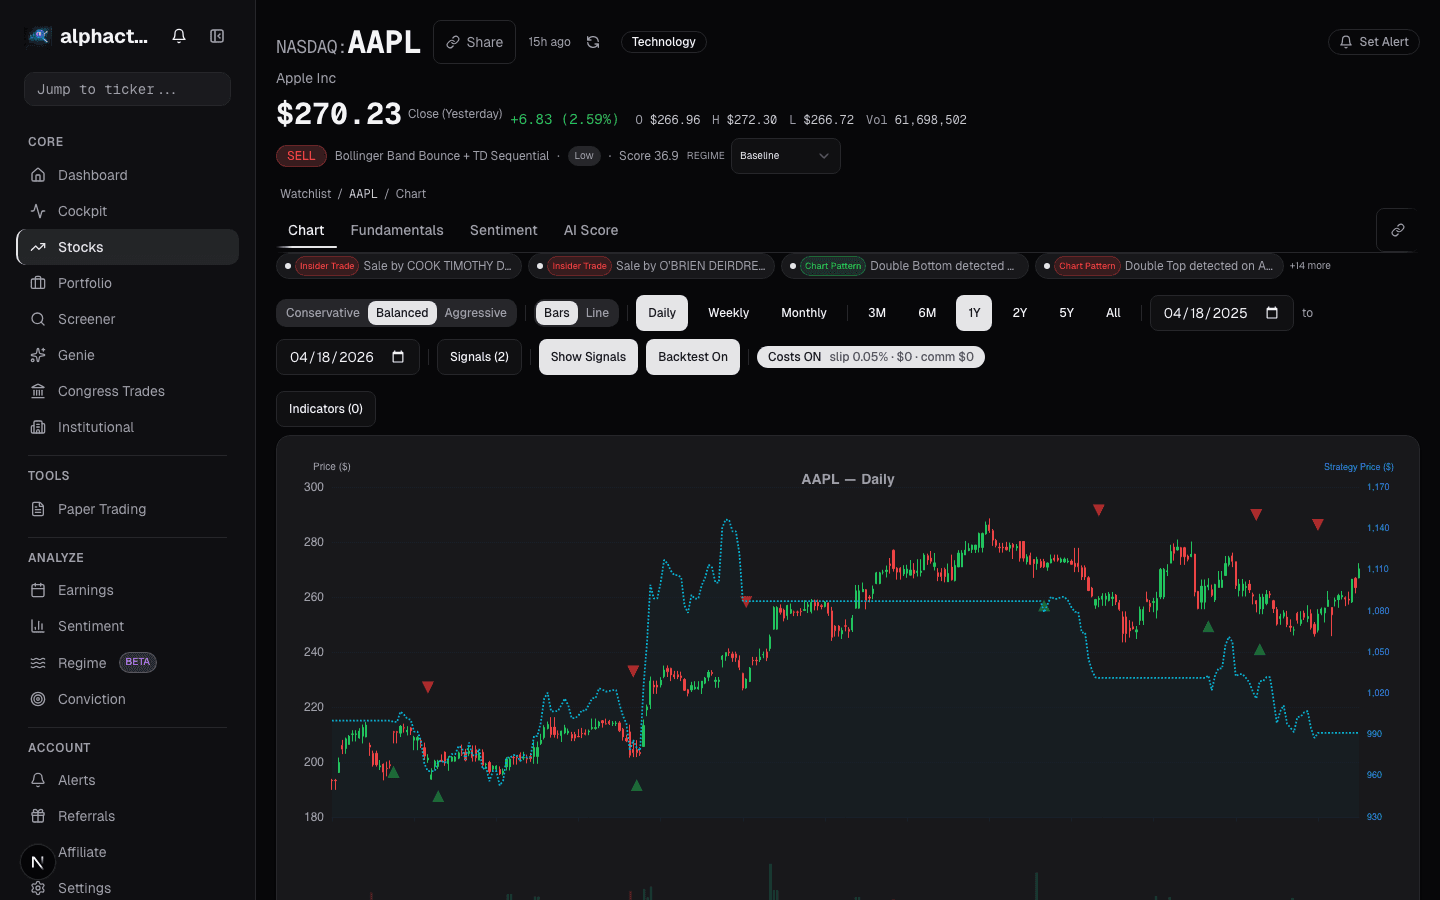
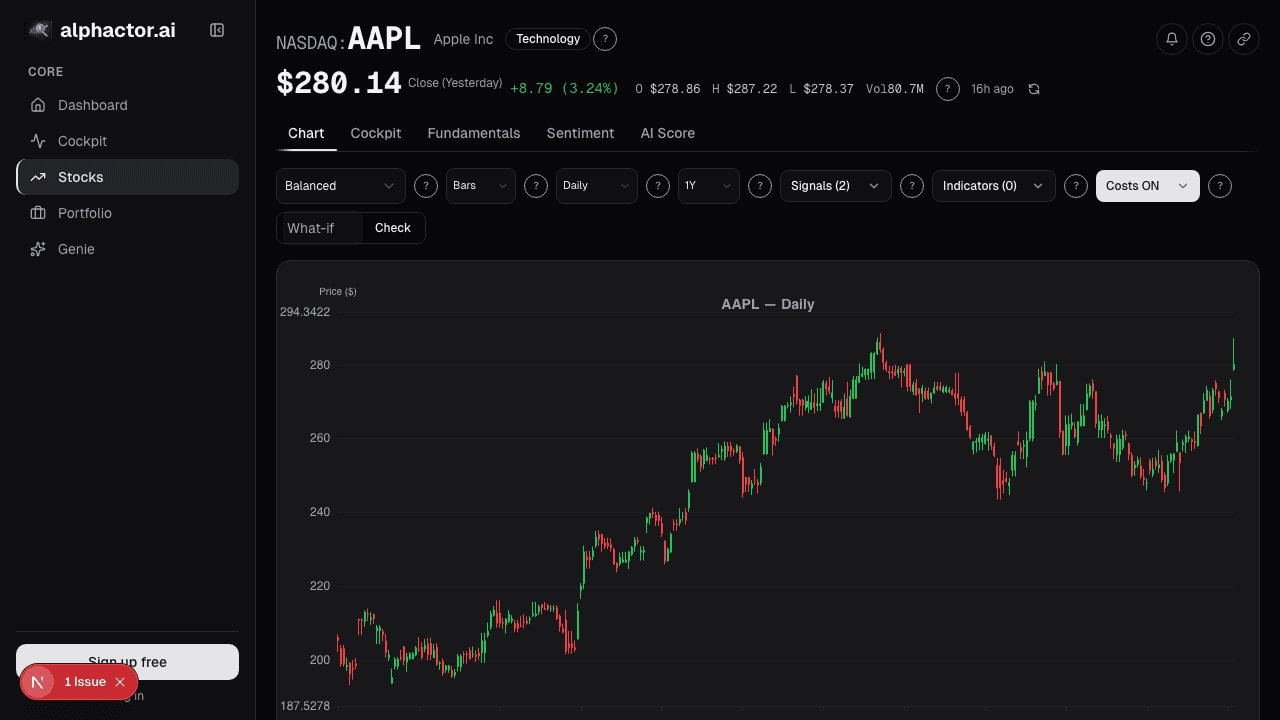
See it in the app
Live dashboard views that match this post. Each tile deep-links to the exact card.


Stocks mentioned
Related reading
Breakout Strategies
A systematic look at breakout trading across 500 stocks over 10 years, with real numbers on win rates, expectancy, and the filters that separate signal from…
Earnings Season Checklist: What to Watch Before, During
A structured approach to earnings season: how to prepare, what metrics matter on the call, and how to interpret post-earnings price action.
Factor Investing in Plain English
Value, momentum, quality, size, and volatility: the five major investment factors explained without jargon, with practical applications for retail portfolios.
Regime-Aware Strategy Selection
Markets cycle through trends, ranges, and shocks. Learn how regime detection drives which strategy runs, and why a mixture of experts beats a single static…
Risk Management for Retail Portfolios
Practical position sizing, stop-loss strategies, correlation awareness, and drawdown limits for retail investors managing their own money.
Ready to try alphactor.ai?
Validate your trading strategies with statistical credibility testing. Start free.
Get Started Free