Part of: Fundamental Analysis
Gross Margins as a Moat Indicator: What 40%+ Really Means
Why gross margin is one of the strongest signals of competitive advantage, how to interpret it by sector, and what margin trends reveal about business quality.
 Sarah Patel4 min read
Margins Tell You Who Has Pricing Power
Gross margin, the percentage of revenue remaining after subtracting the direct cost of goods sold, is one of the most underappreciated metrics in fundamental analysis. It answers a deceptively simple question: how much value does this company capture from each dollar of sales before any operating expenses, interest, or taxes?
A company with 70% gross margins is keeping 70 cents of every revenue dollar to cover operating expenses and generate profit. A company with 20% gross margins keeps only 20 cents. That spread is not random. It reflects the strength of the company's competitive position.
High gross margins almost always trace back to one or more structural advantages: brand recognition that supports premium pricing, intellectual property that prevents direct competition, network effects that lock in customers, or switching costs that make it painful to leave. Low gross margins suggest commodity economics, intense price competition, or a business model that depends on volume rather than value.
The 40% Threshold
Forty percent gross margin has emerged as a useful, if imperfect, dividing line. Companies consistently above 40% tend to possess genuine competitive advantages. Those below it are more likely competing on price or scale, which is inherently less durable.
Consider the contrast within consumer goods. Coca-Cola maintains gross margins around 60%, reflecting a brand so entrenched that consumers pay a significant premium over private label alternatives. A commodity food producer operates at 15-25% gross margins because buyers treat its products as interchangeable.
In software, the gap is even starker. Microsoft, Adobe, and Salesforce all operate above 70% gross margins. Their products are deeply embedded in customer workflows, renewal rates exceed 90%, and the marginal cost of serving an additional user is near zero. Compare that to IT services firms like Cognizant or Infosys at 30-35%, where revenue depends on billable hours and labor costs scale linearly.
Sector Benchmarks
Gross margin norms vary dramatically by industry, so comparisons must stay within peer groups:
- Software/SaaS: 65-85% (near-zero marginal costs)
- Pharmaceuticals: 60-80% (patent protection, high pricing power)
- Consumer Staples (branded): 40-60% (brand premiums, established distribution)
- Semiconductors: 45-65% (IP-driven, cyclical demand)
- Industrials: 25-40% (materials and labor-intensive)
- Retail (grocery): 25-35% (thin margins, high volume)
- Energy: 15-40% (commodity-driven, volatile)
A semiconductor company at 55% gross margins is performing well within its peer group. A SaaS company at 55% would be concerning, suggesting either a services-heavy model or pricing pressure.

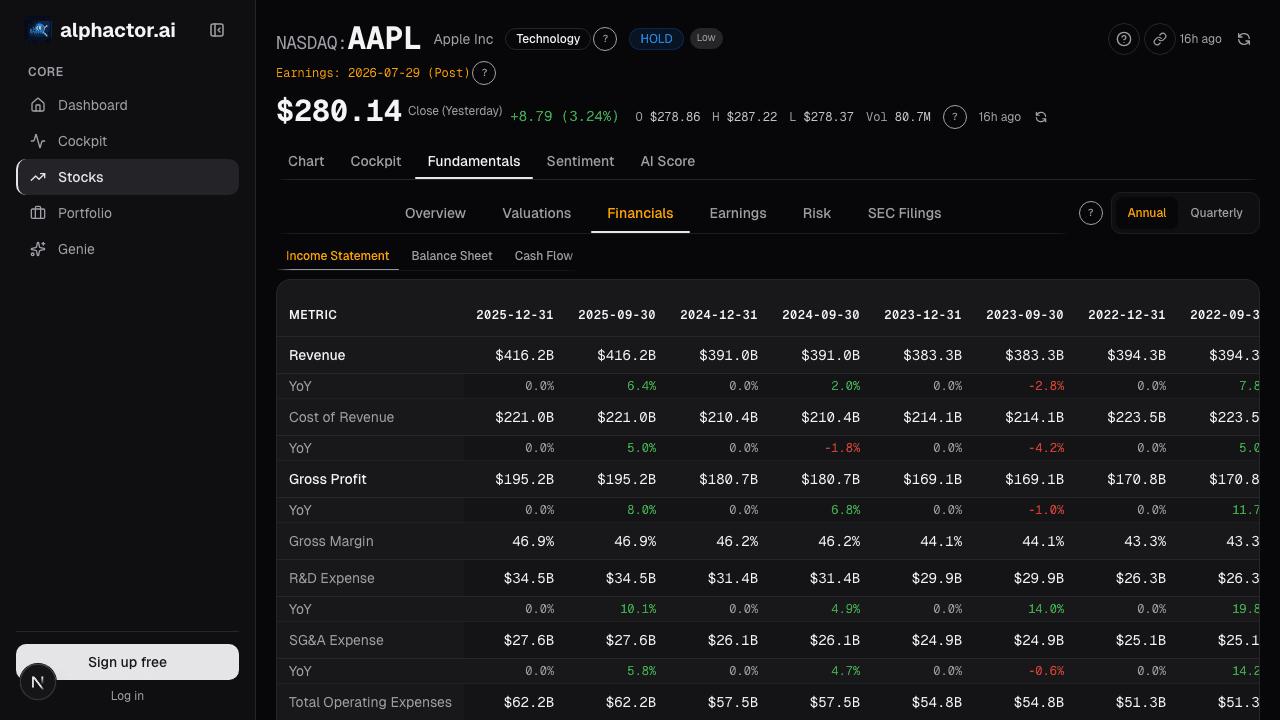
Alphactor's fundamentals view shows gross margins plotted against sector medians, making it straightforward to identify whether a company leads or lags its peers.
Trends Matter More Than Snapshots
A single year's gross margin is less informative than the trajectory over five to ten years. Three patterns stand out:
Expanding margins signal improving competitive position. The company is gaining pricing power, achieving economies of scale, or shifting its revenue mix toward higher-value products. Apple's gross margin expansion from the low 30s in its Mac-centric era to the mid-40s as services revenue grew illustrates this perfectly.
Stable margins in the face of inflation, competition, and market changes indicate a durable moat. Costco has maintained gross margins around 12-13% for over two decades. That consistency, at intentionally low levels, reflects its membership model and disciplined strategy, not weakness.
Declining margins deserve immediate investigation. If a company's gross margin has dropped from 55% to 45% over three years, something is eroding its competitive position. It might be new competitors, commoditization of the product, input cost inflation the company cannot pass through, or a strategic shift toward lower-margin segments.
Gross Margin vs. Operating Margin
Gross margin tells you about the product economics. Operating margin (which further subtracts R&D, sales, and administrative costs) tells you about business efficiency. Both matter, but they diagnose different things.
A company can have outstanding gross margins but poor operating margins if it overspends on sales and marketing or bloats its corporate overhead. Many high-growth SaaS companies show 75% gross margins alongside negative operating margins because they are spending aggressively to acquire customers. Whether that trade-off creates value depends on whether the customers stick around and generate lifetime value that exceeds acquisition cost.
Using Gross Margins in Practice
When screening for quality businesses with the universe scanner, gross margin is one of the first filters worth applying. Start with companies above their sector median, then look for stability or expansion over at least five years.

Combine this with return on equity and free cash flow conversion. A company with 60% gross margins, 20% ROE, and free cash flow exceeding net income is almost certainly a high-quality business with structural advantages. Whether the stock is a good investment at its current price is a separate question, but you are at least starting from a strong foundation.
The inverse is equally useful. When you encounter a stock with deteriorating gross margins, treat it as a flashing warning regardless of what the earnings headline says. Margins are the moat made visible, and when they erode, the competitive position is eroding with them.
See it in the app
Live dashboard views that match this post. Each tile deep-links to the exact card.

Stocks mentioned
Related reading
Accruals Quality: How to Spot Earnings That Aren't Real
Accruals measure the gap between reported earnings and actual cash. Widening accruals is one of the most reliable red flags in financial analysis, Sloan's…
Altman Z-Score: A Bankruptcy Predictor That Still Works
Edward Altman's 1968 discriminant model predicts bankruptcy within two years about 72% of the time at its distress threshold.
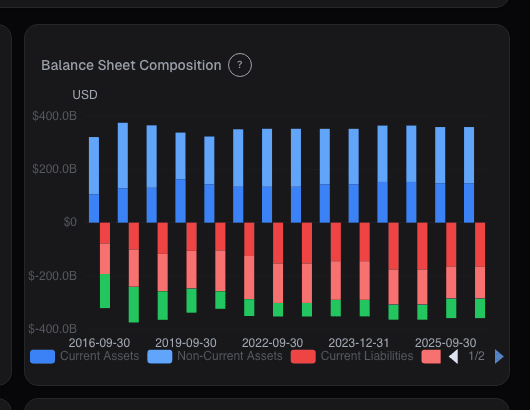
Balance Sheet Deep Dive
Balance sheet changes lead income statements by 2-6 quarters. Net debt, receivables days, and goodwill are the lines that move stocks first.
Price-to-Book Value: Useful for Banks, Misleading for Tech
Price-to-book works for banks and asset-heavy industrials but misleads for software. Here is how to apply it correctly by sector and when to skip it.
Income Statement Waterfall
A waterfall chart makes margin composition visible at a glance. How to separate durable margin expansion from a pull-forward that breaks within 18 months.
Ready to try alphactor.ai?
Validate your trading strategies with statistical credibility testing. Start free.
Get Started Free