Part of: Fundamental Analysis
How to Analyze REITs: FFO, NAV
A practical guide to REIT-specific valuation metrics, including FFO, AFFO, NAV, and the cap rate framework that replaces traditional equity analysis.
 Sarah Patel4 min read
Standard Metrics Do Not Work Here
Real Estate Investment Trusts are structured differently from every other equity sector, and analyzing them with standard tools produces misleading results. A REIT's P/E ratio is almost always distorted because depreciation, a massive non-cash expense for property-heavy businesses, artificially suppresses reported earnings.
REITs hold physical assets that often appreciate in value while accounting rules force depreciation on the income statement. A well-maintained apartment building in a growing city is worth more today than when it was built, but GAAP earnings treat it as losing value every year. Analyzing REITs requires a different toolkit.
FFO: The REIT Earnings Metric
Funds from Operations (FFO) is the standard earnings metric for REITs, developed by NAREIT specifically to address the depreciation distortion. FFO starts with net income, adds back depreciation and amortization, and excludes gains or losses on property sales.
The formula: FFO = Net Income + Depreciation & Amortization - Gains on Property Sales
FFO gives you a cleaner picture of the recurring cash the REIT generates from its operations. Price-to-FFO (P/FFO) replaces P/E as the primary valuation multiple. As of early 2026, sector-average P/FFO ratios range from roughly 12x for office REITs (structural headwinds) to 25x or higher for data center and industrial REITs (strong demand trends).
AFFO: Getting Closer to Real Cash
Adjusted Funds from Operations (AFFO) takes FFO one step further by subtracting recurring capital expenditures needed to maintain properties (new roofs, HVAC replacements, parking lot resurfacing) and adding back non-cash rent adjustments like straight-line rent.
AFFO is closer to true free cash flow and is a better indicator of how much cash the REIT actually has available to pay dividends. A REIT with high FFO but enormous maintenance capex requirements will have a lower AFFO, revealing that not all of the apparent earnings are distributable.
The AFFO payout ratio (dividends divided by AFFO) tells you whether the dividend is sustainable. Below 80% is comfortable. Between 80-90% is manageable but leaves little room for error. Above 90% is a warning sign that any earnings hiccup could force a dividend cut.
Net Asset Value: What the Properties Are Actually Worth
NAV analysis attempts to value the REIT's property portfolio at current market prices rather than depreciated book value. The approach involves estimating the net operating income (NOI) of each property or portfolio segment, dividing by an appropriate capitalization rate to derive property value, and subtracting debt.
A cap rate is simply NOI divided by property value. A property generating $5 million in NOI valued at $100 million has a 5% cap rate. Lower cap rates imply higher valuations and typically reflect lower risk or higher growth expectations.
When a REIT's stock price trades below its estimated NAV, the market is pricing the properties at a discount to what they would fetch in private transactions. This discount can represent a buying opportunity if the underlying properties are sound, or it can reflect legitimate concerns about property values declining.
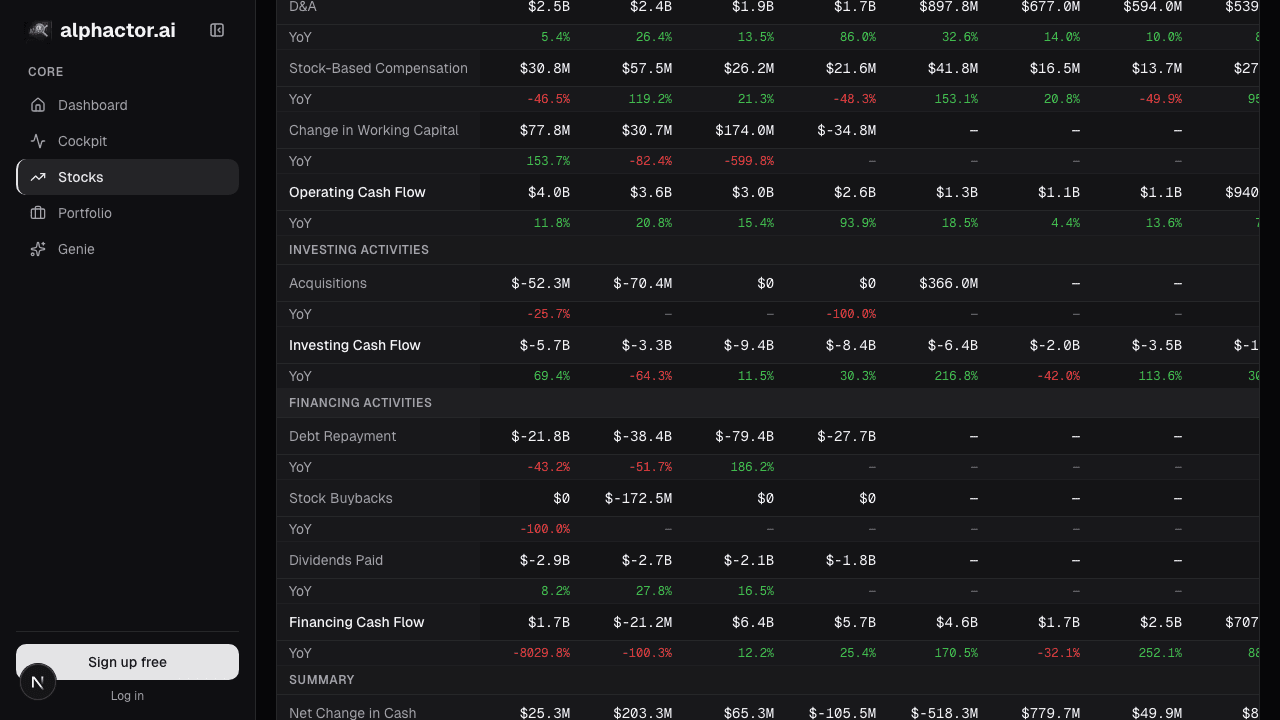
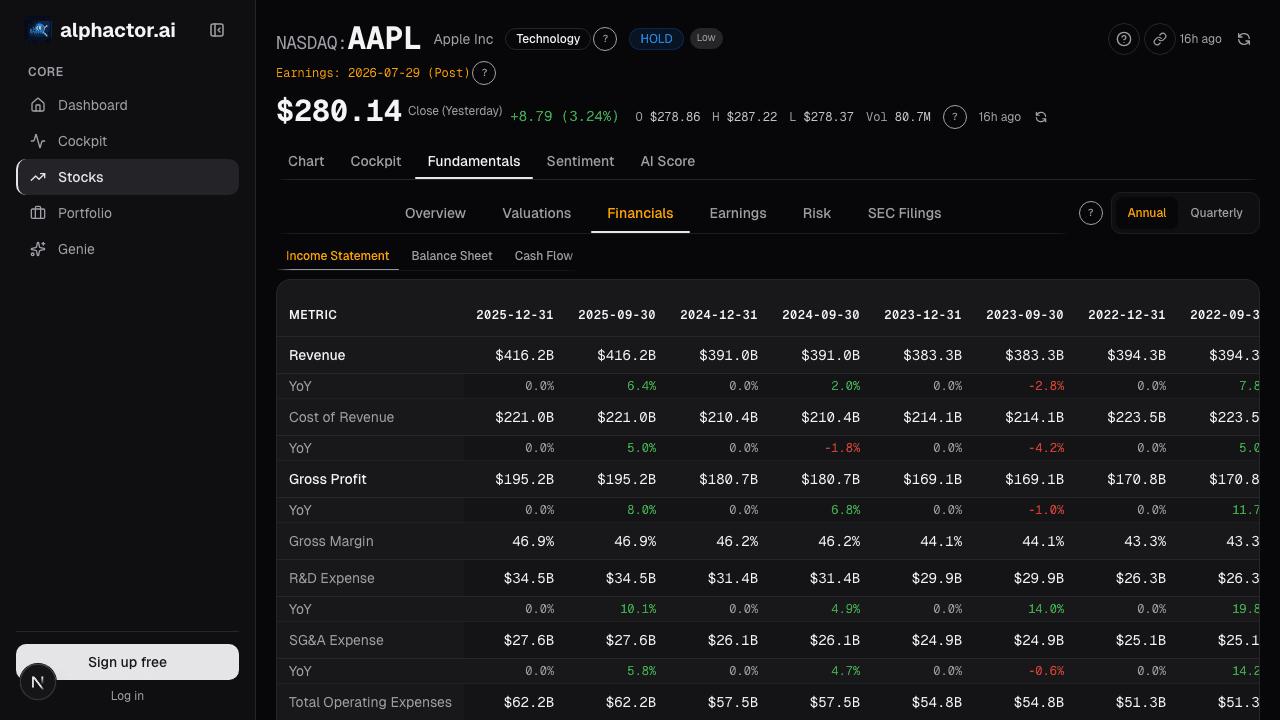
Alphactor's fundamentals view displays P/FFO and dividend yield metrics for REITs, making peer comparison straightforward within property type categories.
Property Type Matters Enormously
REIT performance diverges dramatically by property type, and the last several years have made this abundantly clear.
Industrial and logistics (Prologis, Rexford Industrial) benefited from e-commerce growth driving warehouse demand. Occupancy rates above 97% gave these landlords extraordinary pricing power, with some achieving 50-70% rent spreads on lease renewals.
Data centers (Equinix, Digital Realty) ride the structural demand for cloud computing and AI infrastructure. These REITs combine real estate stability with technology growth characteristics.
Residential (AvalonBay, Equity Residential, Invitation Homes) benefit from housing affordability constraints that keep renters in the market longer. Single-family rental REITs have emerged as a distinct sub-category with strong demand tailwinds.
Office (Boston Properties, Vornado) faces secular headwinds from remote work adoption. Even premium Class A office properties in gateway cities are seeing elevated vacancy rates. Investors demand significant discounts to NAV to compensate for uncertain demand.
Retail (Simon Property Group, Realty Income) has bifurcated between Class A malls and necessity-based retail, which have stabilized, and Class B/C malls, which continue to struggle.
The Interest Rate Sensitivity Question
REITs are perceived as bond proxies, and their stock prices often move inversely with interest rates. This relationship is real but overstated. Rising rates increase borrowing costs and make dividend yields less attractive relative to Treasuries. However, rates typically rise during strong economies that drive occupancy and rent growth. The REITs most vulnerable to rising rates are those with high leverage, short-term debt maturities, and limited pricing power, not the sector as a whole.
Building a REIT Analysis
Start with property type selection based on your demand thesis. Screen within that type using P/FFO, AFFO payout ratio, and debt-to-EBITDA (below 6x is conservative for REITs). Compare NAV estimates where available. Use the universe scanner to filter REIT-specific metrics and identify names trading at discounts to sector peers. The combination of property type conviction and valuation discipline is what separates REIT investors who earn 8-10% annual total returns from those who buy the wrong property type at the wrong price.
See it in the app
Live dashboard views that match this post. Each tile deep-links to the exact card.

Stocks mentioned
Related reading
Accruals Quality: How to Spot Earnings That Aren't Real
Accruals measure the gap between reported earnings and actual cash. Widening accruals is one of the most reliable red flags in financial analysis, Sloan's…
Altman Z-Score: A Bankruptcy Predictor That Still Works
Edward Altman's 1968 discriminant model predicts bankruptcy within two years about 72% of the time at its distress threshold.
Balance Sheet Deep Dive
Balance sheet changes lead income statements by 2-6 quarters. Net debt, receivables days, and goodwill are the lines that move stocks first.
Price-to-Book Value: Useful for Banks, Misleading for Tech
Price-to-book works for banks and asset-heavy industrials but misleads for software. Here is how to apply it correctly by sector and when to skip it.
Defense Stocks: Government Contracts as a Revenue Moat
How defense contractors generate durable revenue through government contracts, and the metrics that matter for analyzing Lockheed Martin, RTX, and their peers.
Utility Stocks for Income: Yield, Safety
How to evaluate utility stocks for income portfolios, including the regulatory framework, rate sensitivity dynamics, and metrics that identify quality…
Ready to try alphactor.ai?
Validate your trading strategies with statistical credibility testing. Start free.
Get Started Free